Figures & data
Table 1 Primer Sequences of RT-PCR
Figure 1 Flow chart of the study design.
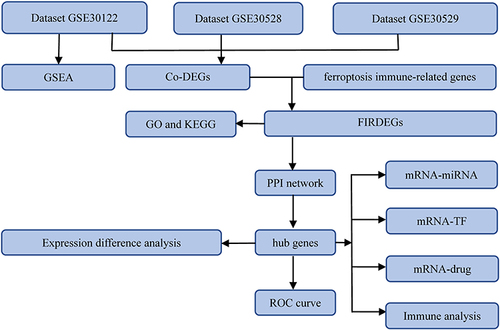
Figure 2 Differential gene analysis of diabetic kidney diseases databases. (A) The volcano map of GSE30122. (B) The volcano map of GSE30528. (C) The volcano map of GSE30529. (D) The heatmap of GSE30122. (E) The heatmap of GSE30528. (F) The heatmap of GSE30529. (G) Venn diagram of the Co-DEGs in GSE30122, GSE30528 and GSE30529. (H) Venn diagram of Co-DEGs and FIRGs.
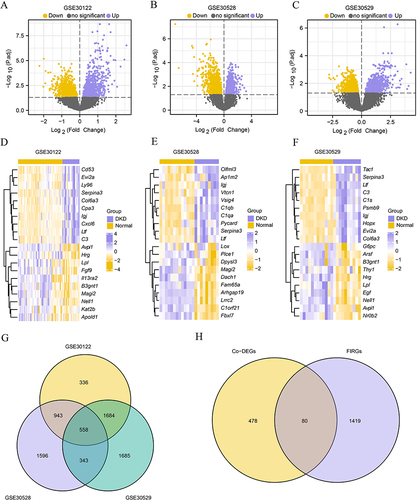
Table 2 GO Enrichment Analysis Results of Ferroptosis Immune Related DEGs
Table 3 KEGG Enrichment Analysis Results of Ferroptosis Immune Related DEGs
Figure 3 Go and KEGG Functional enrichment analysis. The bubble chart of (A) GO and (B) KEGG enrichment analyses of FIRDEGs. The circular trellis of (C) GO and (D) KEGG enrichment analyses of FIRDEGs. The bar graph of (E) GO and (F) KEGG enrichment analyses of FIRDEGs. The screening criteria for GO and KEGG enrichment items were P < 0.05 and FDR < 0.05.
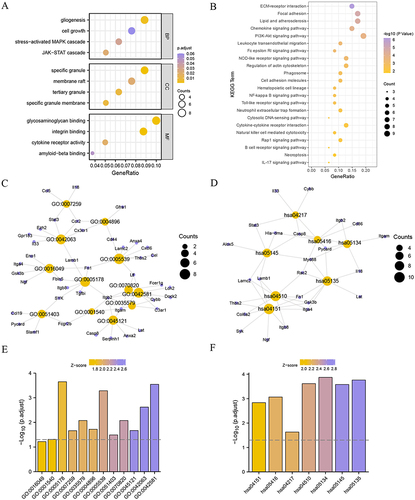
Figure 4 Gene set enrichment analysis. (A) GSEA plot showing most enriched gene sets in the DKD group and normal controls. The differential expression genes in GSE30122 were significantly enriched in (B) PI3K pathway, (C) IL10 pathway, (D) Notch pathway and (E) IL17 pathway. The screening criteria for GSEA items were P < 0.05 and FDR < 0.25.
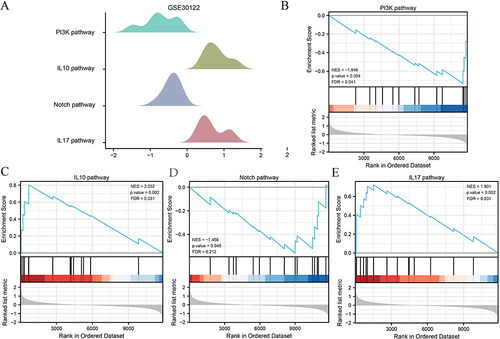
Figure 5 Protein–Protein Interaction Network. (A) PPI network of FIRDEGs. (B) Venn maps of common genes of the top 15 FIRDEGs were selected using five algorithms: MCC, MNC, EPC, Degree and DMNC. (C) PPI network of the six hub genes.
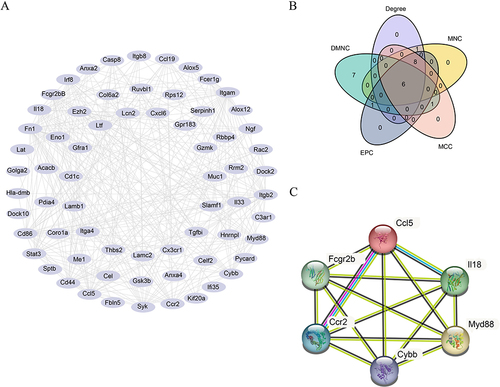
Figure 6 Multi-factor regulatory analysis. (A) The mRNA-miRNA interaction network of hub genes. (B) The mRNA-TF interaction network of the hub genes. (C) The mRNA–drug interaction network of hub genes.
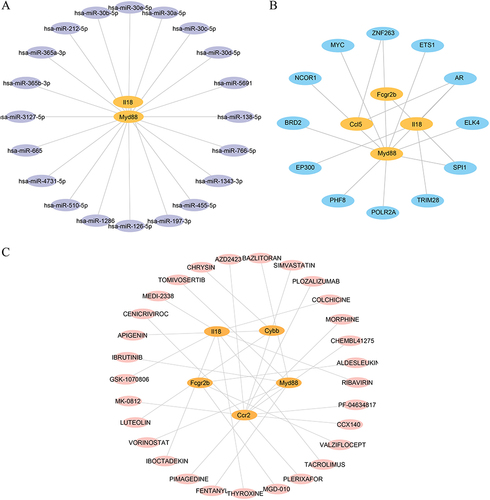
Figure 7 Expression differences and correlation analysis of hub genes. Group comparison of the expression of hub genes in datasets (A) GSE30122, (C) GSE30528, and (E) GSE30529. Correlation heatmap of hub gene expression in datasets (B) GSE30122, (D) GSE30528, and (F) GSE30529. Vs Normal group, *P < 0.05, **P < 0.01 and ***P < 0.001.
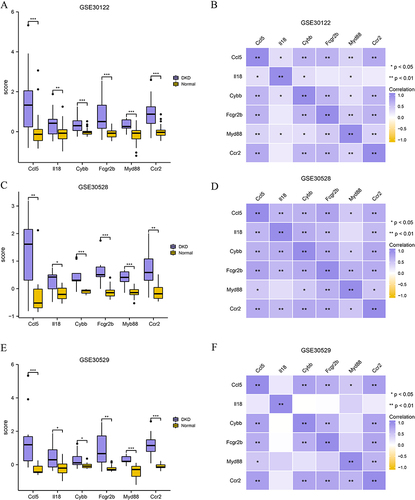
Figure 8 Clinical relevance of the expression of ferroptosis immune-related DEGs. Correlation analysis between GFR and (A) Ccl5, (B) Ccr2, (C) Cybb, (D) Fcgr2b, (E) Il18, (F) Myd88; Correlation analysis between serum creatinine and (G) Ccl5, (H) Ccr2, (I) Cybb, (J) Fcgr2b, (K) Il18, (L) Myd88.
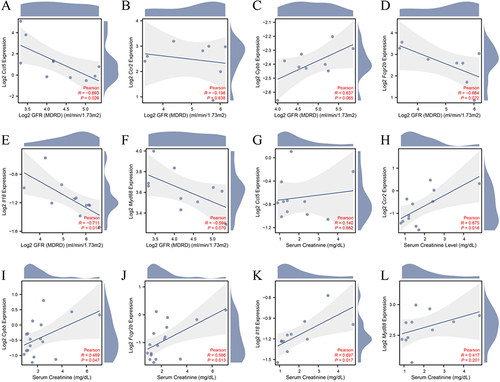
Figure 9 ROC curve analysis. ROC curves for (A) Ccl5, (B) Il18, (C) Cybb, (D) Fcgr2b, (E) Myd88, and (F) Ccr2 in the GSE30122 dataset. ROC curve of (G) Ccl5, (H) Il18, (I) Cybb, (J) Fcgr2b, (K) Myd88, and (L) Ccr2 in the GSE30528 dataset. ROC curves of (M) Ccl5, (N) Il18, (O) Cybb, (P) Fcgr2b, (Q) Myd88, and (R) Ccr2 in the GSE30529 dataset.
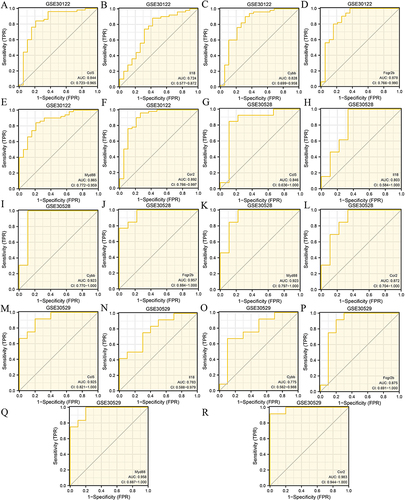
Figure 10 Immune cell-infiltration analysis of GSE30122 dataset. (A) Bar chart of immune cell infiltration in the dataset. (B) Comparison of immune cell infiltration between normal and NC groups. (C) Correlation heatmap of FIRDEGs and immune cells in GSE30122 dataset. Vs Normal group; *P < 0.05; **P < 0.01 and ***P < 0.001.
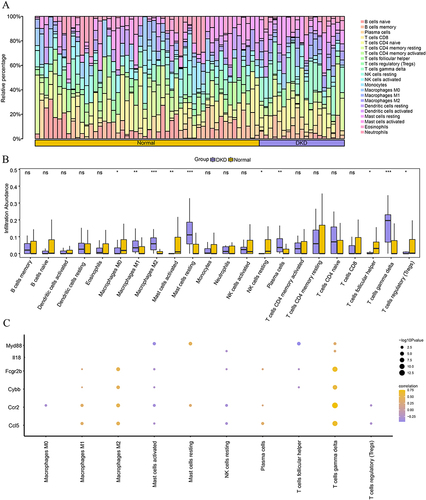
Figure 11 Basic information of mouse model. (A) Kidney weight/body weight ratio. (B) Blood glucose level. (C) 24 h urine albumin excretion levels. (D) Serum creatinine level. (E) Serum urea nitrogen. (F) H&E staining of the mouse kidneys. (G) PAS staining of mouse kidneys. The results are expressed as the mean ± SD. **P < 0.01, ***P < 0.001, ****P < 0.0001 vs db/m. All figures scale bar = 50 μm.
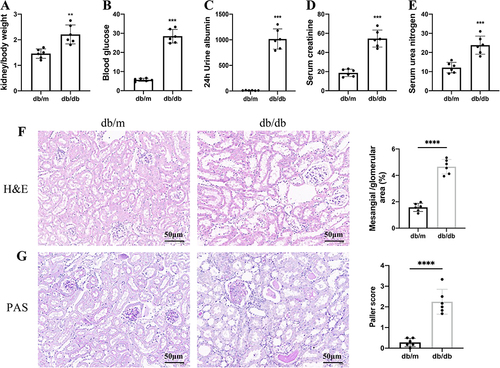
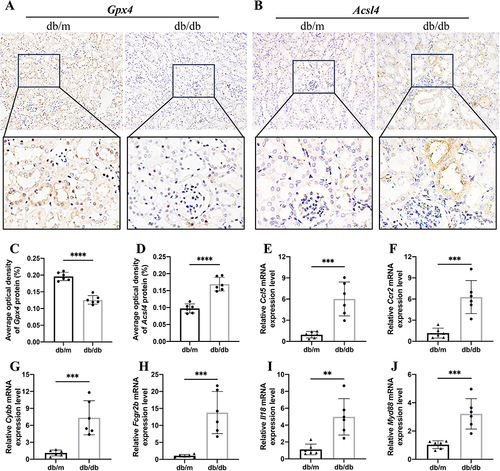
Figure 12 Validation of ferroptosis immune-related DEGs in mouse model. (A) IHC assay of Gpx4 protein expression in the mouse kidneys. (B) IHC assay of Acsl4 protein expression in the mouse kidneys. The AOD of (C) Gpx4 and (D) Acsl4 between two groups. (E–J) Relative expression of mRNA by RT-PCR (n = 6). The results are expressed as the mean ± SD. **P < 0.01, ***P < 0.001, ****P < 0.0001 vs db/m. All figures scale bar = 50 μm.