
Figures & data
Figure 1 Flowchart of participants through the study.
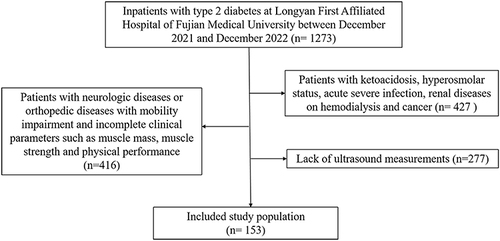
Table 1 Baseline Characteristics of Patients with and without Sarcopenia
Table 2 Correlation Between Clinical Indicators and US Features
Table 3 Stepwise Regression of Sarcopenia
Figure 2 The results of ROC curve of the model in identifying sarcopenia. (A) The AUC, sensitivity and specificity of the model in total participants. (B) The AUC, sensitivity and specificity of the model in male. (C) The AUC, sensitivity and specificity of the model in female.
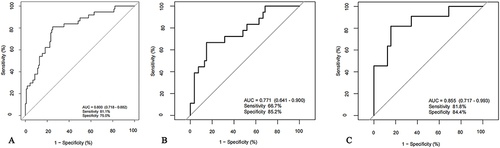
Table 4 Stepwise Regression of ASMI
Figure 3 Correlations between the estimated ASMI and actual ASMI.
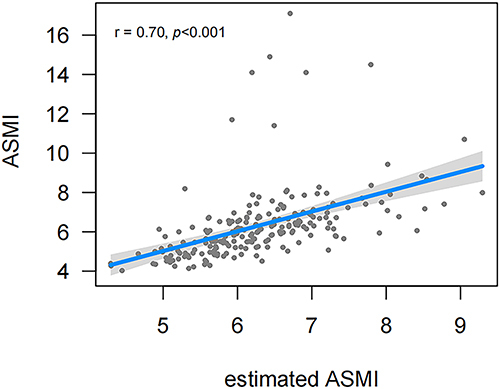
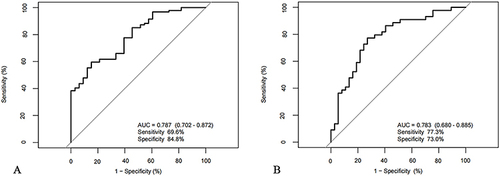
Figure 4 The results of ROC curve of the model in identifying low muscle mass. (A) The AUC, sensitivity and specificity of the model in male. (B) The AUC, sensitivity and specificity of the model in female.
Data Sharing Statement
Data relevant to this study are available from the corresponding authors upon reasonable request.