
Figures & data
Table 1 Patient Demographics Grouped According to LSG and RYGB
Figure 1 Trends in weight loss and metabolic indicators from baseline to 3 months and 12 months postoperative for the overall and in both LSG and RYGB data sets. (A-I) represents trends in weight loss and metabolic markers in the total, LSG, and RYGB datasets from baseline to 3 and 12 months post-operative.
Notes: A-I represents box plots of changes in BMI, WC, FPG, HbA1c, SBP, DBP, TC, HDL, and LDL before, 3 months and 12 months after surgery, respectively.
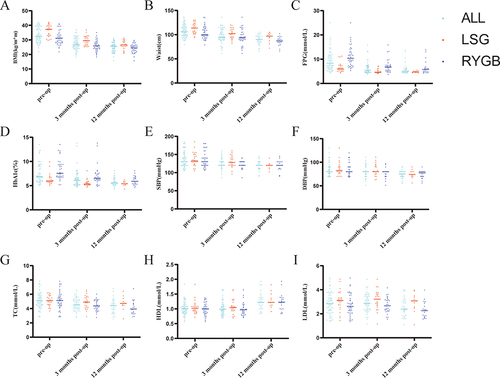
Table 2 10-Year Change in CVD Risk Calculated by Different Cardiovascular Risk Models in LSG and RYGB
Table 3 Comparison of the 10-Year Risk of CVD After LSG and RYGB by Different Risk Models
Table 4 30-Year Change in CVD Risk Calculated by FRS in LSG and RYGB
Table 5 Comparison of the 30-Year Risk of CVD After LSG and RYGB by Different Risk Models