
Figures & data
Table 1 Comparison of Clinical and Demographic Data and Fasting Indicators Between the Two Groups
Table 2 Comparison of Blood Lipid Levels and ANGPTL3, ANGPTL4, and ANGPTL8 at Different Time Points Before and After High-Fat Meal Consumption
Figure 1 Comparison of blood lipid levels at different time points before and after high-fat meal consumption. (A) TC. (B) TG. (C) HDL-C. (D) LDL-C. (E) TRL-C. (F) Non-HDL-C.
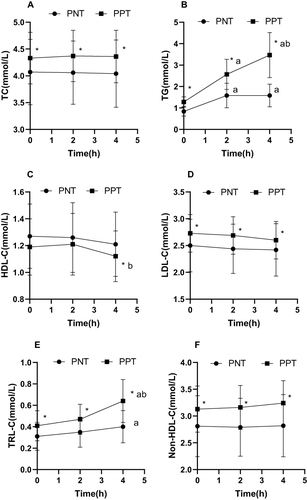
Figure 2 Comparison of blood lipid levels and ANGPTL3, ANGPTL4, and ANGPTL8 at different time points before and after high-fat meal consumption. (A) ApoA1. (B) ApoB. (C) ApoA1/ ApoB. (D) ANGPTL3. (E) ANGPTL4. (F) ANGPTL8.
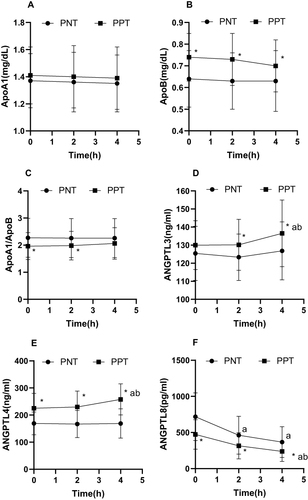
Table 3 Correlation Analysis of Fasting ANGPTL3, ANGPTL4, and ANGPTL8 Levels with Clinical and Demographic Data and Fasting Indices
Figure 3 Changes in lipid levels and AUC of lipid after a high-fat diet in the three groups. (A) HDL-C. (B) AUC of HDL-C. (C) TRL-C. (D) AUC of TRL-C. (E) ApoA1. (F) AUC of ApoA1.
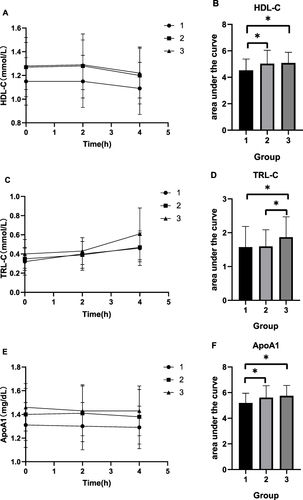
Figure 4 Changes in lipid levels and AUC of lipid after a high-fat diet in the three groups. (A) TC. (B) AUC of TC. (C) TG. (D) AUC of TG. (E) LDL-C. (F) AUC of LDL-C.
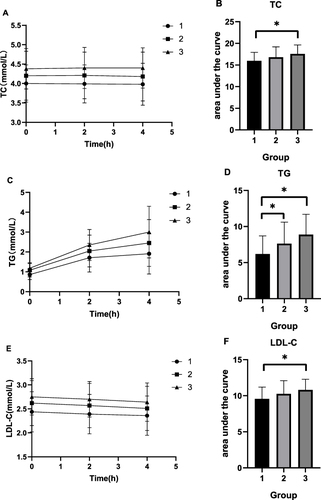
Figure 5 Changes in lipid levels and AUC of lipid after a high-fat diet in the three groups. (A) TRL-C. (B) AUC of TRL-C. (C) Non-HDL-C. (D) AUC of Non-HDL-C. (E) ApoB. (F) AUC of ApoB.
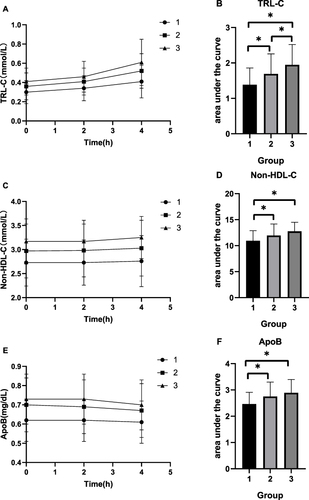
Figure 6 Changes in lipid levels and AUC of lipid after a high-fat diet in the three groups. (A) TG. (B) AUC of TG.
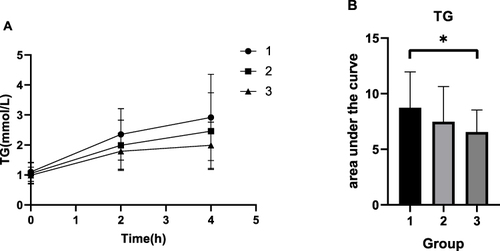
Table 4 Logistic Regression Analysis of Fasting ANGPTL3, ANGPTL4, ANGPTL8 and PPT
Data Sharing Statement
The datasets generated and/or analyzed during this study are not publicly available due to their containing that could compromise the privacy of the research participants but are available from the corresponding author on reasonable request.