Figures & data
Figure 1 Missing values of variables.
Abbreviations: SBP, systolic blood pressure; DBP, diastolic blood pressure; HR, heart rate; WBC, white blood cell count; NEU, neutrophil count; EOS, eosinophil count; BASO, basophil count; LYC, lymphocyte count; RBC, red blood cell count; HB, hemoglobin; RDW, red blood cell distribution width; MCV, mean red blood cell volume; PLT, platelet count; PDW, platelet distribution width; MPV, mean platelet volume; ALT, alanine aminotransferase; AST, aspartate aminotransferase; TBil, total bilirubin; DBil, direct bilirubin; IBil, indirect bilirubin; TP, total protein; ALB, albumin; GLB, globulin; GGT, gamma-glutamyl transpeptidase; TBA, total bile acids; BUN, blood urea nitrogen; Scr, serum creatinine; SUA, serum uric acid; FBG, fasting blood glucose; TC, total cholesterol; TG, triglycerides; HDL, high-density lipoprotein; LDL, low-density lipoprotein; Apo-A1, apolipoprotein -A1; Apo-B, apolipoprotein-B; NAFLD, nonalcoholic fatty liver disease.
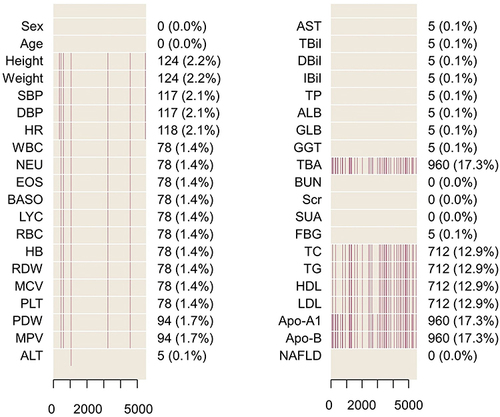
Figure 2 Flowchart of the participants.
Abbreviations: HUA, hyperuricemia; ROC, the receiver operating characteristic; TyG, triglyceride-glucose; METS-IR, metabolic score for insulin resistance; NAFLD, nonalcoholic fatty liver disease.
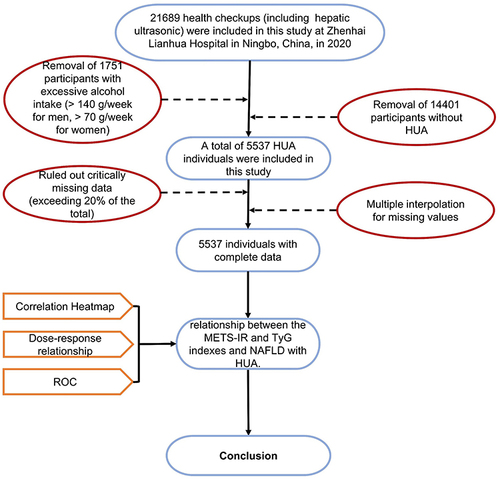
Table 1 Univariate Analysis of NAFLD in the HUA Population
Table 2 Multivariable Logistic Regression Analysis
Figure 3 Association of independent risk factors.
Notes: The color determines the sign of the coefficient, where the red color represents a positive effect and the blue color indicates a negative one. The intensity of the color increases proportionally to the magnitude of the correlation coefficient among the genes. The values of the correlation coefficients are shown in the lower left corner. *P < 0.05, **P < 0.001.
Abbreviations: GLB, globulin; DBP, diastolic blood pressure; TP, total protein; Apo-B, apolipoprotein-B; TyG, triglyceride-glucose; AST, aspartate aminotransferase; TG, triglycerides; HR, heart rate; METS-IR, metabolic score for insulin resistance; ALT, alanine aminotransferase; PLT, platelet count; EOS, eosinophil count; BASO, basophil count; SUA, serum uric acid; HB, hemoglobin; Scr, serum creatinine; HDL, high-density lipoprotein; MCV, mean red blood cell volume.
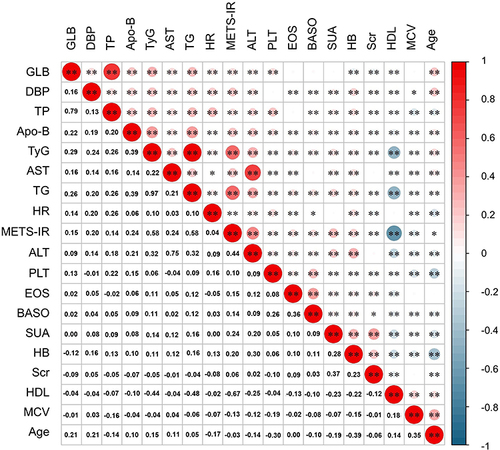
Figure 4 Dose–response association between the TyG index (A), the METS-IR index (B) and the risk of NAFLD with HUA modeled by using RCS.
Abbreviations: TyG, triglyceride-glucose; METS-IR, metabolic score for insulin resistance; NAFLD, nonalcoholic fatty liver disease; HUA, hyperuricemia.
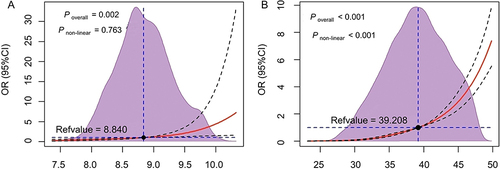
Table 3 Youden Index and Other Evaluation Measures of AUC
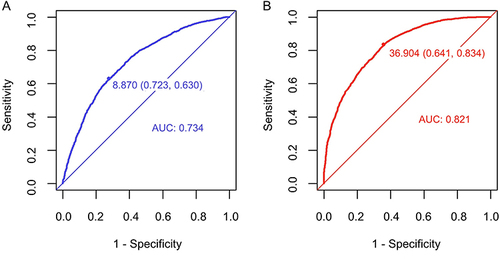
Figure 5 The ROC curves of the TyG index (A) and the METS-IR index (B) for prediction of NAFLD with HUA.
Abbreviations: TyG, triglyceride-glucose; METS-IR, metabolic score for insulin resistance; NAFLD, nonalcoholic fatty liver disease; HUA, hyperuricemia.