Figures & data
Figure 1 The technical flowchart of this study population.
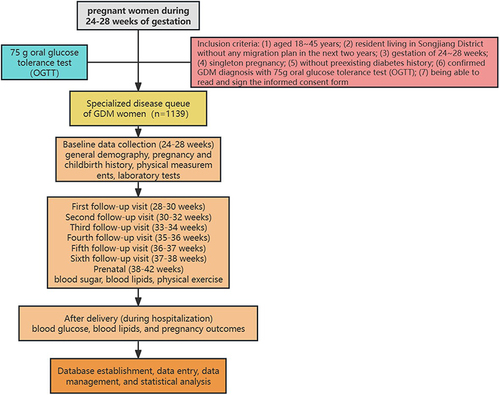
Table 1 The Demographic Features Among Women with GDM (n = 1139)
Table 2 Moderate-Intensity Physical Exercise, Glucose Control, and Adverse Pregnancy Outcomes Status Among Women with GDM (n = 1139)
Table 3 Moderate-Intensity Physical Exercise Time Among GDM Women with Different Glucose Control Status (n = 1139)
Table 4 Moderate-Intensity Physical Exercise Time Among GDM Women with Different Pregnancy Outcome Status (n = 1139)
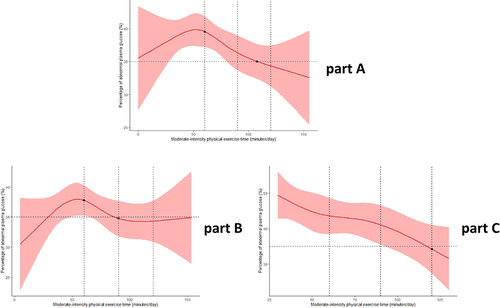
Figure 2 The influence of moderate-intensity physical exercise time on plasma glucose control during pregnancy among GDM women with different BMI levels.
Figure 3 The association between moderate-intensity physical exercise time and the percentage of abnormal plasma glucose among totally GDM women (A), underweight or normal weight GDM women (B), overweight or obese GDM women (C).