Figures & data
Figure 1 Workflow Diagram for ML Model Development with Liver Radiomics from Duplex Ultrasound. The process begins with image segmentation and radiomics analysis, leading to the establishment and validation of the ML model. In wavelet transformation, “L” represents low-frequency coefficients, while “H” signifies high-frequency coefficients.
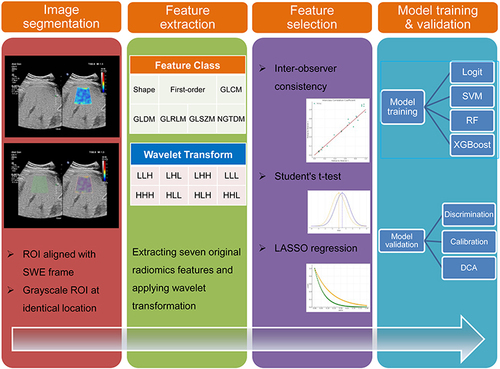
Figure 2 Flowchart of Patient Selection and Cohort Distribution for Developing and Validating Predictive Models in T2DM Patients with NAFLD.
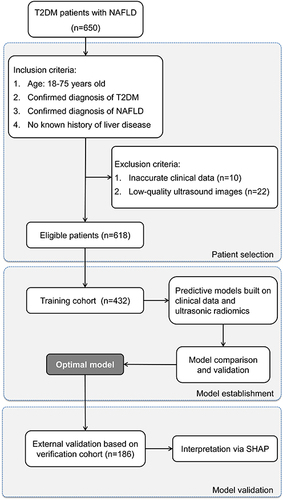
Table 1 Comparative Clinical Characteristics of Low-Risk and Fibrosis-Risk Patients
Table 2 Performance of ML Classifiers for Predicting Fibrosis Progression Risk Using Clinical Data, Radiomics Features, and Combined Datasets in T2DM Patients with NAFLD
Figure 3 Comparative Analysis of ML Classifiers across Different Data Types. (A–C) reveal the performance (ROC, calibration, and DCA curves) of ML classifiers (Logit, SVM, RF, and XGBoost) applied to clinical data, with ROC-AUCs of 0.70, 0.66, 0.65, and 0.69, respectively. (D–F) show these classifiers’ performance based on radiomics features, yielding AUCs of 0.93, 0.92, 0.89, and 0.90. (G–I) display their performance when applied to combined clinical and radiomics data, with AUCs reaching up to 0.94, 0.95, 0.87, and 0.91. While the combined data models demonstrate the highest AUC values, a noticeable decrement in calibration is observed, highlighting the superior suitability of radiomics-based models for evaluating fibrosis progression risk in T2DM patients with NAFLD. Among these, SVM demonstrates superior discrimination and calibration, and comparable DCA curve performance, designating it as the most effective classifier.
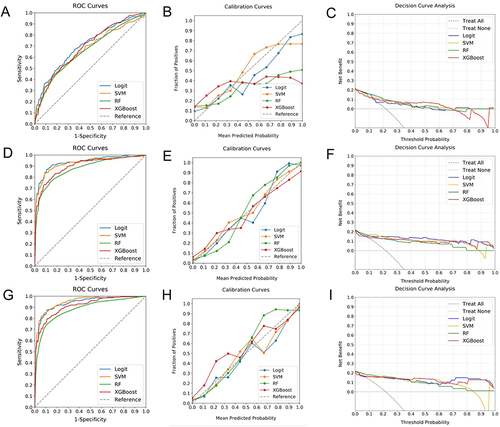
Figure 4 Evaluating Predictive Performance of Optimal ML Model with External Verification Cohort. (A) exhibits the ROC curve with an AUC of 0.87, indicating the significant discriminative capacity of the model. (B) reveals the calibration curve, demonstrating a robust agreement between predicted probabilities and actual observed events, particularly for predictions beyond a 50% threshold. (C) illustrates the DCA, emphasizing the net clinical benefit provided by the model across the entire spectrum of prediction probabilities.
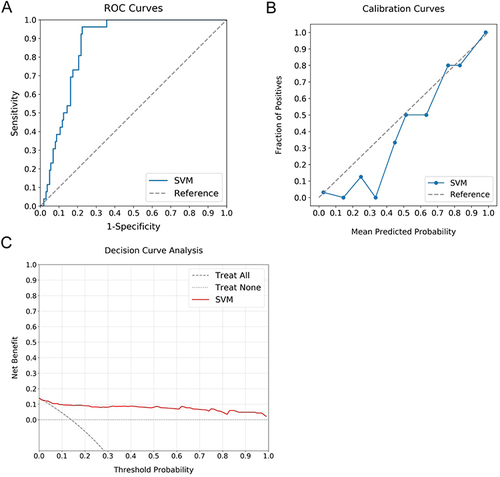
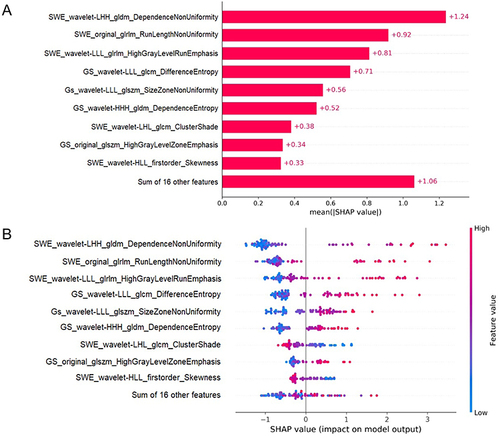
Figure 5 SHAP Analysis of the SVM Model for Hepatic Fibrosis Prediction. (A) illustrates the ranking of feature significance as determined by absolute mean SHAP values, with three radiomics features from SWE and two from GS identified as the top five critical determinants. (B) presents a summary plot incorporating SHAP values, providing a comprehensive visualization of the cumulative influence of each feature. This graphical depiction indicates a correlation between higher values of the top five features and an increased risk of hepatic fibrosis.