Figures & data
Figure 1 Study flowchart.
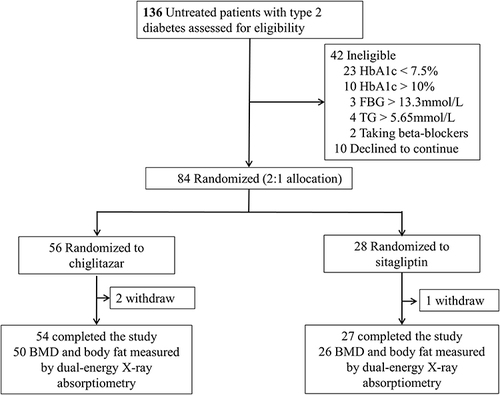
Table 1 Baseline Characteristics of Study Patients
Table 2 Comparison of BMD Within Groups Before and After 24-Weeks Treatment and the Changes from Baseline to Week 24 Between Two Groups. Data Shown as Mean ± SEM
Table 3 Comparison of Body Composition and ADP Levels Within Groups Before and After 24-Weeks Treatment. Data Shown as Mean ± SEM
Table 4 Changes of Body Composition and ADP Levels from Baseline to Week 24 Between Two Groups. Data Shown as Mean ± SEM
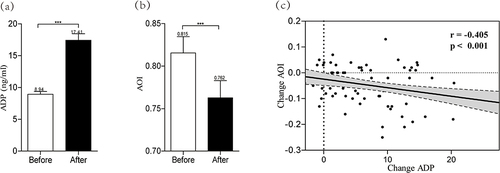
Figure 2 The changes in ADP and their correlation with the changes in AOI.
Notes: (a) ADP and (b) AOI levels before and after treatment with chiglitazar or sitagliptin in all eligible participants, with values presented as the mean. ***P < 0.001. Error bars show SEM. (c) Correlation between change of ADP and that of AOI. Correlation controlled for age, change of BMI and FM. 95% confidence limits are shown.