
Figures & data
Table 1 Clinical Characteristics of Study subjects
Figure 1 The correlation between HbA1c and serum fructosamine.
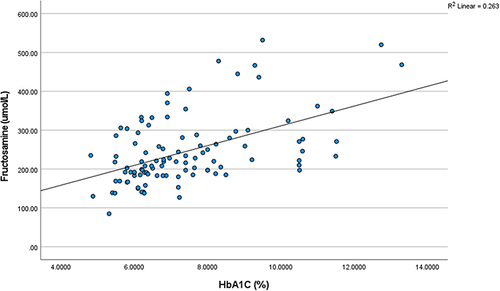
Figure 2 The correlation between GG and HbA1c.
Abbreviation: GG, glycation gap.
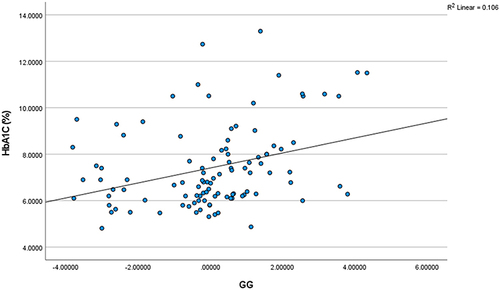
Table 2 Correlation Between UACR and Some Glycemic Parameters
Figure 3 The correlation between GG and UACR.
Abbreviations: GG, glycation gap; UACR, urinary albumin creatinine ratio.
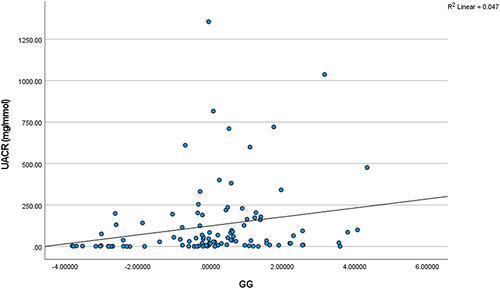
Table 3 Relationships Between Some Glycemic Parameters and UACR
Table 4 Correlation Between Some Glycemic Parameters and eGFR
Figure 4 The correlation between GG and eGFR.
Abbreviations: GG, glycation gap; eGFR, estimated glomerular filtration rate.
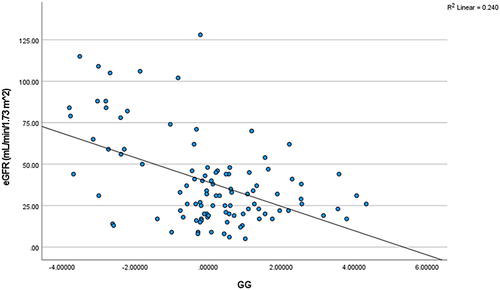
Table 5 Relationships Between Some Glycemic Parameters and eGFR