Figures & data
Table 1 Demographic Characteristics, Anthropometric Indicators and Body Composition in Overweight and Obese Patients According to AHI
Table 2 Multivariate Linear Regression Models for Predicting Log (AHI) in Overweight and Obese Patients
Table 3 Paired Comparisons of Anthropometric Indicators, Body Composition and AHI at Baseline and After a 12-Week Weight Loss Intervention
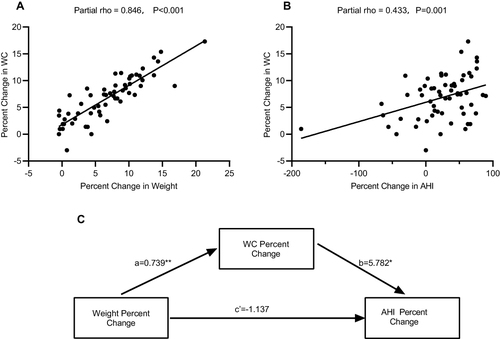
Figure 1 Association between percent change in WC, percent change in body weight and percent change in AHI. (A) Percent change in body weight had a positive association with that in WC; (B) percent change in WC had a positive association with that in AHI; (C) schematic diagram of WC as a mediator between percent change of body weight and AHI.
Notes: coefficient a, the effect of percent change in weight on percent change in WC; coefficient b, the effect of percent change in WC on percent change in AHI; coefficient c’, the direct effect of percent change in body weight on percent change in AHI. *p < 0.05, **p < 0.01.
Abbreviations: WC, waist circumference; AHI, apnoea-hypopnoea index.