
Figures & data
Table 1 Demographic and Basal Characteristics of the Studied Cohort
Figure 1 Glycosylated hemoglobin at baseline and 3-, 6-, and 12-months follow-up.
Note: n=Sample size.
Abbreviation: HbA1C, Glycosylated hemoglobin (5).
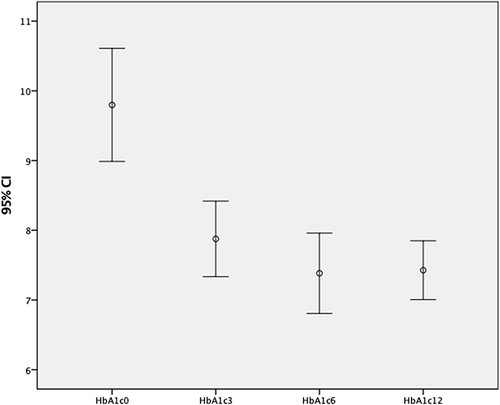
Figure 2 Baseline body weight and at follow-up at 3, 6 and 12 months.
Notes: Weight is expressed in kilograms, n=Sample size.
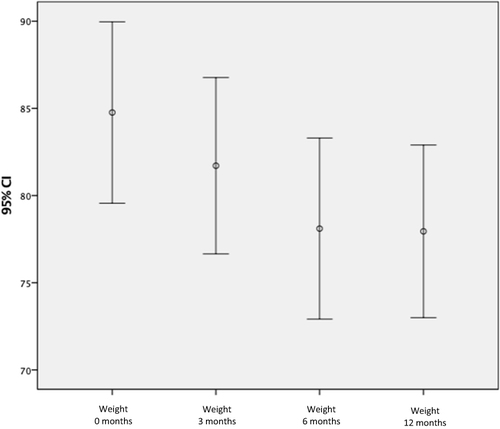
Table 2 ACR Index Classification Baseline and During the Follow-Up
Table 3 Adverse Reactions Presented During the Study Time