
Figures & data
Table 1 Baseline Characteristics of NALFD and Non-NAFLD
Table 2 Comparison of General Information and Laboratory Parameters Between Quartile Groups of LSMI
Figure 1 Prevalence of nonalcoholic fatty liver disease (NAFLD) across quartile groups of LSMI.
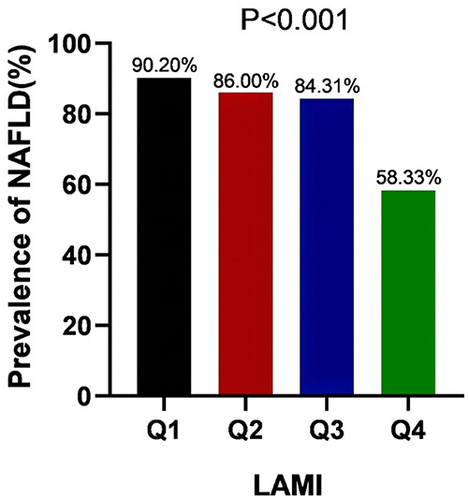
Table 3 Spearman Correlation Between LSMI and SMI and NAFLD
Table 4 Odds Ratios of the Risk for NAFLD in Type 2 Diabetes Mellitus
Figure 2 (A) LSMI, SMI predicts ROC curve for NAFLD. (B) LSMI combined with SMI predicts ROC curve NAFLD.
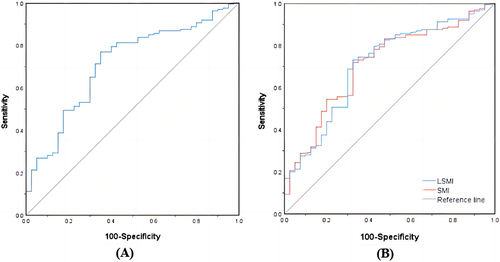
Table 5 Linear Regression Analysis of Factors Influencing Indicators of NAFLD