
Figures & data
Table 1 Characteristics of the Subjects in Each Triglyceride-Waist Phenotypes
Figure 1 Prevalence of hyperuricemia by sex and triglyceride waist phenotypes; (a) All subjects, (b) Gender classification.
Abbreviations: NTNW, normal TG and normal waist; NTGW, normal TG with enlarged waist; HTNW, high TG with normal waist; HTGW, high TG with enlarged waist.
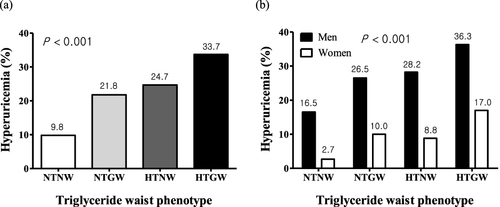
Table 2 Odds Ratios for Hyperuricemia at Different Levels of Triglyceride Waist Phenotypes
Table 3 Association of HTGW Phenotype and Hyperuricemia
Table 4 Odds Ratios for Hyperuricemia According to Triglyceride Waist Phenotypes by Various Risk Factors
Table 5 Areas Under the Receiver Operating Characteristic Curve (AUC) of the Indicators to Detect Hyperuricemia