Figures & data
Table 1 Baseline Characteristics of Healthy Controls and T2DM Patients
Figure 1 Representative MRM chromatography from amino acid quantification of Healthy group (A) and T2DM group (B).
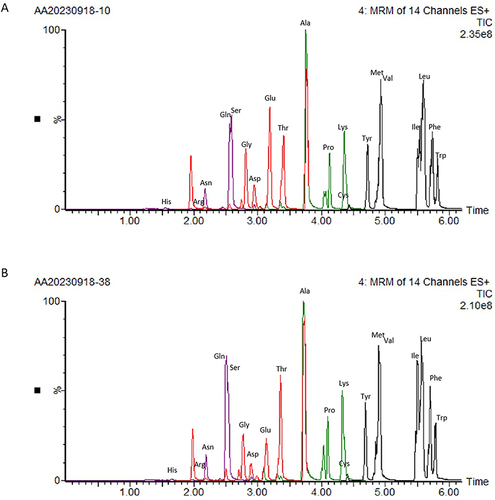
Figure 2 (A) PCA score plots (n = 30) of the healthy group and T2DM group. (B) Heat maps of normalized amino acids concentrations in serum sample. Columns represent the samples (Healthy and T2DM groups), and rows represent amino acids.
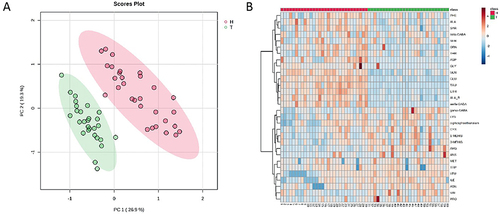
Table 2 Standard Curve Linearity Data Obtained for the Analyses
Table 3 Amino Acid Concentration in Serum of Healthy Volunteers and T2DM Patients
Figure 3 Quantitative analysis of 8 significant changed amino acids. A two-tailed Mann–Whitney U-test was applied to test for statistical significance; The asterisk denotes a significance, ****p < 0.0001. The content of ARG (A), LEU (B), TAU (C), ETH (D), GLU (E), GLN (F), beta-ALA (G) AND alfa-GABA (H) in the serum of healthy volunteers and T2DM patients.
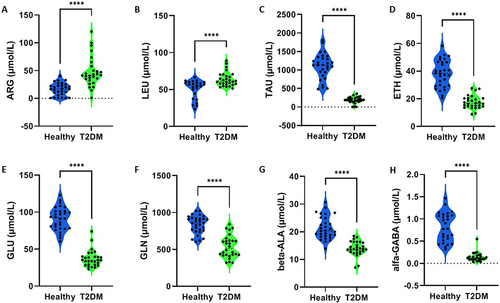
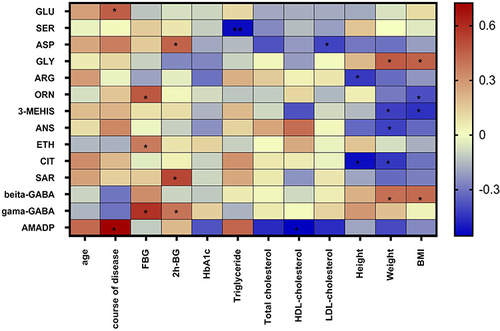
Figure 4 The heatmap of association between physiological parameters and 14 significantly changed amino acids. Red indicates positive correlations, and blue indicates negative correlations. The asterisk denotes a significance, *p < 0.05, **p < 0.01.