Figures & data
Figure 1 Flow chart of the study subjects.
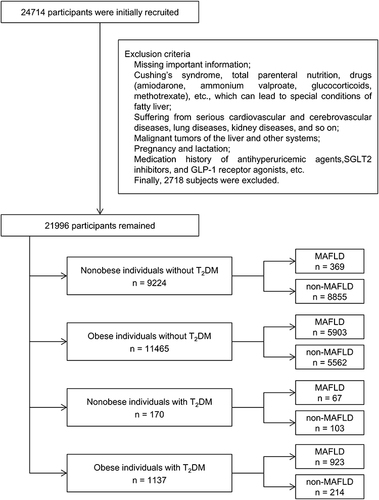
Table 1 Baseline and Clinical Characteristics of Participants with and without Metabolic Dysfunction-Associated Fatty Liver Disease (n=21,996)
Figure 2 The serum uric acid to creatinine ratio value in metabolic dysfunction-associated fatty liver disease and its subgroups. (A) sUA/Cr values in different subgroups. (B) sUA/Cr values in different sex groups. (C) sUA/Cr values in different age groups (years). Data were expressed as mean ± standard deviation () and analyzed by student’s t test.
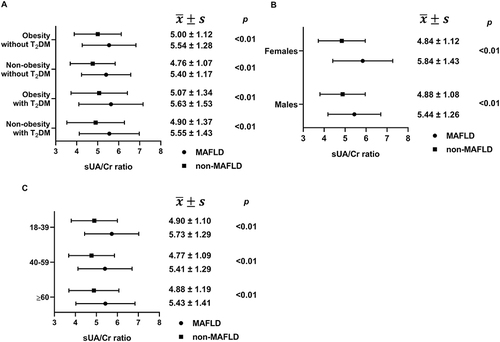
Figure 3 The univariate correlation analysis between serum uric acid to creatinine ratio and metabolic dysfunction-associated fatty liver diseases. (A) Univariate ORs of sUA/Cr in MAFLD and its subgroups. (B) Univariate ORs of sUA/Cr in MAFLD and its subgroups in males. (C) Univariate ORs of sUA/Cr in MAFLD and its subgroups in females. (D) Univariate ORs of sUA/Cr in MAFLD and its subgroups aged 18–39 years old. (E) Univariate ORs of sUA/Cr in MAFLD and its subgroups aged 40–59 years old. (F) Univariate ORs of sUA/Cr in MAFLD and its subgroups aged ≥60 years old.
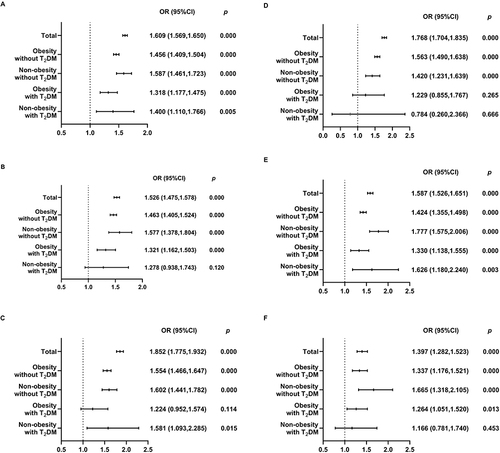
Figure 4 The multivariate correlation analysis between serum uric acid to creatinine ratio and metabolic dysfunction-associated fatty liver diseases. (A) Multivariate ORs of sUA/Cr in MAFLD and its subgroups. (B) Multivariate ORs of sUA/Cr in MAFLD and its subgroups in males. (C) Multivariate ORs of sUA/Cr in MAFLD and its subgroups in females. (D) Multivariate ORs of sUA/Cr in MAFLD and its subgroups aged 18–39 years. (E) Multivariate ORs of sUA/Cr in MAFLD and its subgroups aged 40–59 years. (F) Multivariate ORs of sUA/Cr in MAFLD and its subgroups aged ≥60 years.
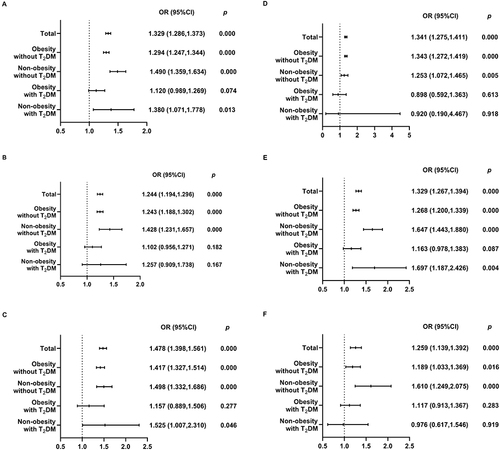
Table 2 Receiver Operating Characteristics Analysis of Serum Uric Acid to Creatinine Ratio in Predicting the Risk of Metabolic Dysfunction-Associated Fatty Liver Disease in Different Groups
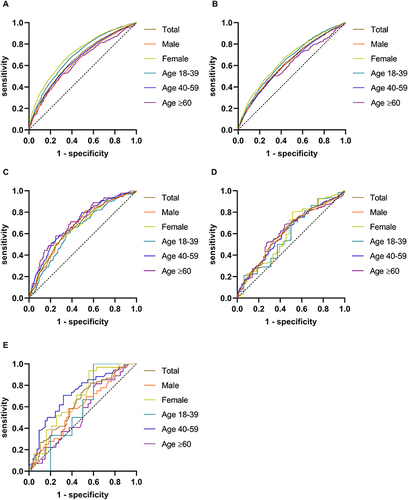
Figure 5 Receiver operating characteristics analysis of serum uric acid to creatinine ratio in predicting the risk of MAFLD in different groups. (A) ROC of overall MAFLD. (B) ROC of obesity without T2DM. (C) ROC of non-obesity without T2DM. (D) ROC of obesity with T2DM. (E) ROC of non-obesity with T2DM.