Figures & data
Table 1 Clinical and Laboratory Characteristics of Study Participants
Figure 1 Scatterplots of plasma asprosin and glyceraldehyde-3-phosphate (G3P) concentrations in healthy, pre-DKD, and DKD patients. Asprosin (A) and G3P (B) concentrations in human plasma samples from indicated group. Each data point represents a plasma sample, the horizontal middle line in each data set represents the mean, and the limits of the vertical lines represent the SD. One-way ANOVA with Tukey’s post hoc test was performed for multiple comparisons. ***P<0.001, **P<0.01.
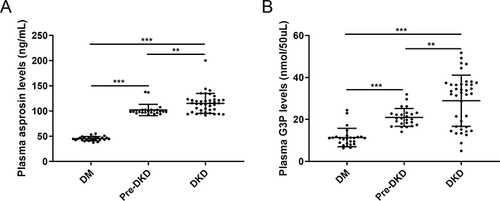
Figure 2 Expression of asprosin in kidney tissue from DKD mouse models. (A) mRNA expression of asprosin in glomeruli and tubulointerstitial tissue. mRNA expression of asprosin in kidney from Stz-induced diabetic (B) and db/db mice (C). Data shown as means and SD, n=6 mice per group. ***P<0.001, **P<0.01.
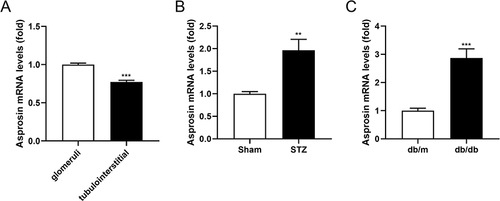
Table 2 Spearman Correlation Coefficients of Variables Associated with Circulating Concentration
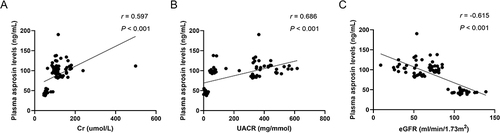
Figure 3 Scatterplots showing correlations of plasma asprosin levels with Cr, UACr, and eGFR in all subjects. (A) Correlation of plasma asprosin levels with Cr. (B) Correlation of plasma asprosin levels with UACr. (C) Correlation of plasma asprosin levels with eGFR.