Figures & data
Table 1 Characteristics of the Participants
Table 2 Analysis of Blood Profiles Across Different Periods Cohort Migraine Patients
Table 3 Analysis of Body Composition Across Different Periods Cohort Migraine Patients
Figure 1 Body weight (A) and waist circumference (B) of cohort migraine patients. *p <0.05, **p <0.01.
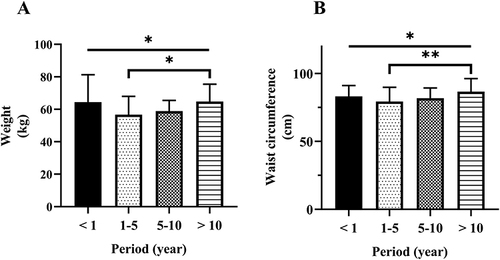
Figure 2 Body weight (A), waist circumference (B), body mass index (BMI) (C), and fat (D) of cohort migraine patients. *p<0.05, **p<0.01.
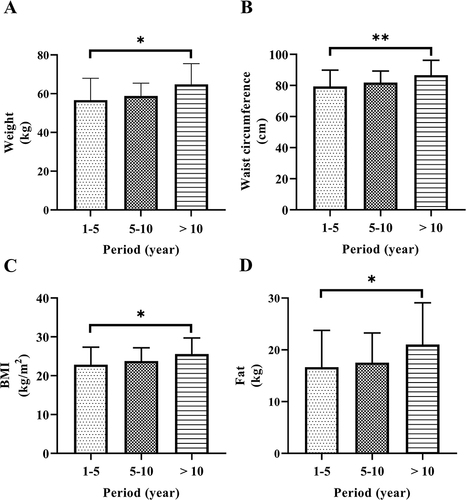
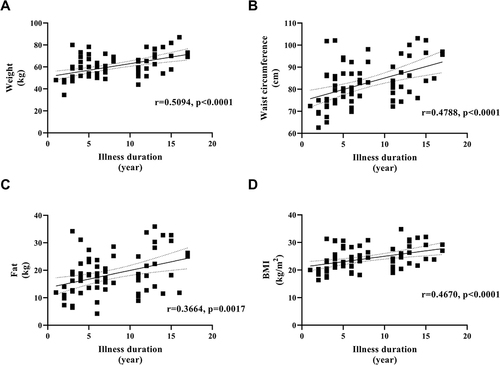
Figure 3 The correlation between the duration of illness and weight (A), waist circumference (B), fat (C), body mass index (BMI) (D) of migraine patients for a period of more than 1 year.