
Figures & data
Table 1 The Specific Normal Value of the Nerve Conduction Velocity
Table 2 Comparison of General Information and Clinical Indicators of All Participants
Table 3 Comparison of Indicators Between the NCVN and NCVA Groups
Figure 1 Comparisons of UHR levels in normal peripheral nerve conduction group and abnormal peripheral nerve conduction group in patients with T2DM.*Denotes significance at a P value of <0.05.
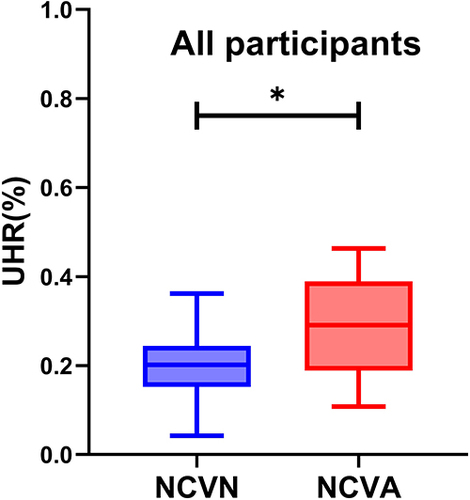
Table 4 Comparison of Indicators Between the Low UHR and High UHR Groups
Figure 2 Comparisons of prevalence of abnormal peripheral nerve conduction in the High UHR group and Low UHR group for all participants. *Denotes significance at a P value of <0.05.
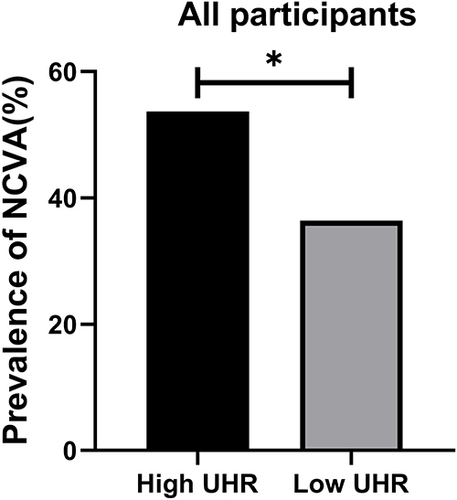
Table 5 The Correlation of UHR and NCV in Patients with T2DM
Table 6 Correlation of UHR with Different Nerve Conduction Velocities in Patients with T2DM in Model 1
Table 7 Correlation of UHR with Different Nerve Conduction Velocities in Patients with T2DM in Model 2
Table 8 Correlation of UHR with Different Nerve Conduction Velocities in Patients with T2DM in Model 3
Table 9 Dichotomous Logistic Regression of Risk Factors for Abnormal Peripheral Nerve Conduction Velocity in T2DM Patients