Figures & data
Figure 1 Differentially expressed genes (DEGs) identification. (A) Volcano plots of DEGs in GSE60436; the abscissa is log2FoldChange, and the ordinate is -log10. Red dots represent up-regulated DEGs, and blue dots represent down-regulated DEGs. (B) Box plots of the data normalization results for the dataset samples. (C) Heat map of DEGs. (D) Venn diagram of DEGs. The number in each circle represents the number of DEGs in the dataset, and the overlapping part of the circle represents the common DEGs between GSE60436 and pyroptosis-related gene dataset.
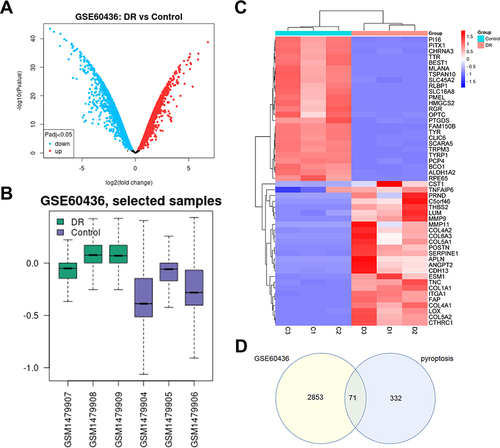
Figure 2 Hub gene analysis. (A) Hub genes identified from protein–protein interaction network. (B) Gene ridge plot. The x-axis represents gene expression levels, and the shape of the ridges represents the distribution of data within each group, with the height indicating the number of samples corresponding to the gene expression level. (C) Principal component analysis plot. The coordinates PC1 and PC2 represent the first and second principal components (ie, latent variables explaining the differences). Points represent samples, and different colors represent different groups. (D) Gene Ontology (GO) pathway diagram, consisting of three parts: genes, LogFold Change (representing the fold change of genes for sorting and color-coding gene blocks), and GO terms. Different connections between genes indicate their involvement in specific GO terms.
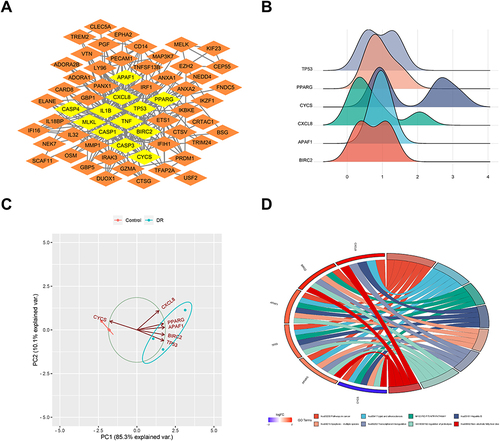
Figure 3 Assessment of diabetic retinopathy (DR) model (N=6). (A) Representative images of hematoxylin and eosin (HE) staining (Amplification: 200×, Scale: 100 μm). The arrows point to the inner nuclear layer cells. The number of inner nuclear layer cells in the model group sparser than that in control group. (B) The concentrations of tumor necrosis factor α (TNF-α), interleukin-1β (IL-1β), and interleukin-18 (IL-18) were detected using enzyme-linked immunosorbent assay (ELISA). (C) The concentrations of vascular endothelial growth factor (VEGF), superoxide dismutase (SOD), and malondialdehyde (MDA) were detected using ELISA. **P<0.01 vs control group.
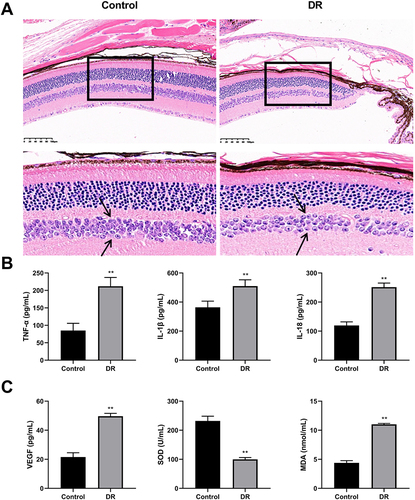
Figure 4 The mRNA expression levels of BIRC2, CXCL8, APAF1, PPARG, TP53, CYCS in tissues were detected by quantitative real-time polymerase chain reaction (qRT-PCR). (N=6), **P<0.01 vs control group.
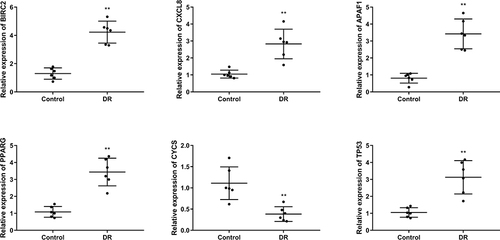
Figure 5 The effect of APAF1 on DR mice. (A) Western blot detected the expression of APAF1, pro-caspase-3, clv-caspase-3, and N-GSDME in DR mice. (B) Representative images of HE staining (Amplification: 200×, Scale: 100 μm). (C) The concentrations of TNF-α, IL-1β, IL-18 were detected using ELISA. (D) The concentrations of VEGF, SOD, and MDA were detected using ELISA. **P<0.01, vs control group; ##P<0.01 vs Lv-sh NC group.
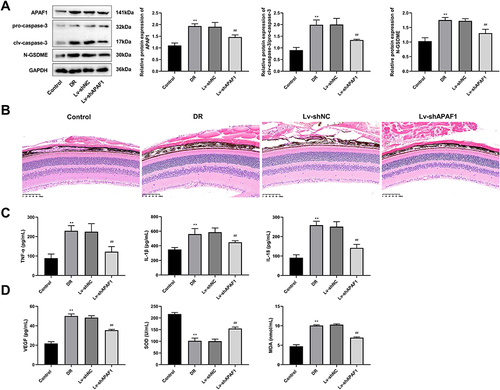
Figure 6 APAF1 silencing promotes proliferation and inhibits apoptosis in high glucose (HG) ARPE-19 cells. (A) The mRNA expression of APAF1 was detected by qRT-PCR. (B) Cell counting kit-8 (CCK-8) was used to detect cell viability. (C) Flow cytometry was used to detect apoptosis rate. **P<0.01, vs control group; ##P<0.01 vs Lv-sh NC group.
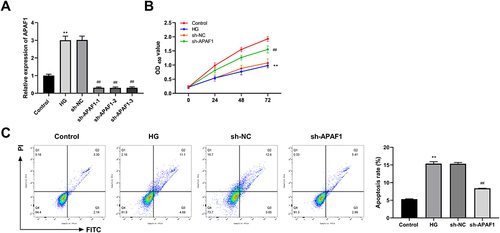
Figure 7 APAF1 silencing inhibits caspase-3/GSDME-dependent pyroptosis in HG-induced ARPE-19 cells. (A) Western blot detected the protein expression of pro-caspase-3, clv-caspase-3, and N-GSDME. (B) The levels of TNF-α, IL-1β, IL-18 were detected by ELISA. (C) ELISA kit detected the concentration of lactate dehydrogenase. **P<0.01, vs control group; ##P<0.01 vs sh-NC group.
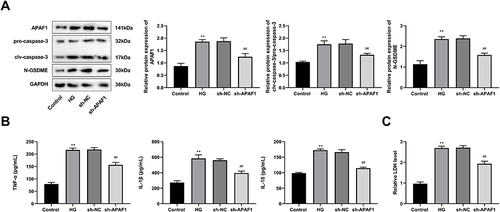
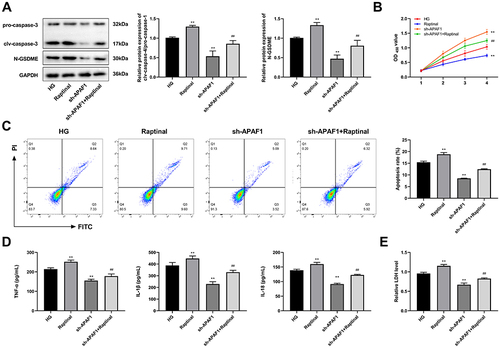
Figure 8 Raptinal reverses the effect of APAF1 silencing on HG-induced ARPE-19 cells. (A) Western blot detected the protein expression of pro-caspase-3, clv-caspase-3, and N-GSDME. (B) CCK-8 was used to assess cell viability. (C) Flow cytometry was used to detect apoptosis. (D) The levels of TNF-α, IL-1β, IL-18 were detected by ELISA. (E) ELISA kit detected the concentration of lactate dehydrogenase. **P<0.01, vs HG group; ##P<0.01 vs sh-APAF1 group.