Figures & data
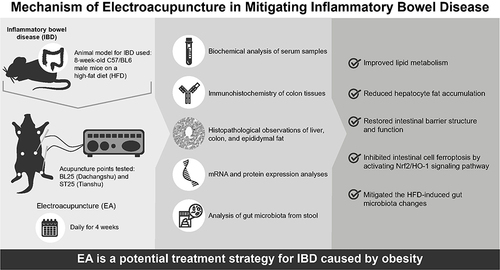
Table 1 Sequences and Product Length of Primers Used
Figure 1 EA reduced body weight and fat deposition (A) Appearance of mice. (B) Body weight gain. (C) Appearance of epididymal fat. (D) HE staining of epididymal adipose tissue and Epididymal adipocyte area (scale bar = 200 µm). (E) Serum TC. (F) Serum TG. (G) Serum LDL-C. (H) Serum HDL-C. n= 6, values are mean ± SEM),*** p < 0.001 (Control vs Model); ## p < 0.01,### p < 0.001 (Model vs EA); Δ p < 0.05, ΔΔ p < 0.01 (EA vs SEA).
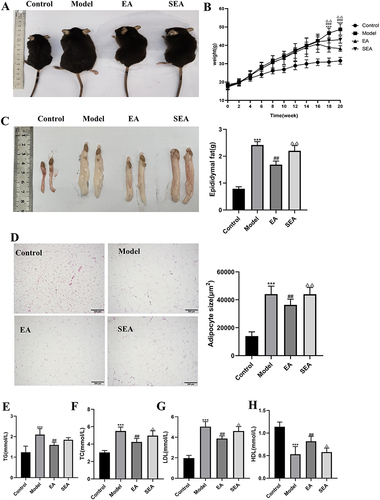
Figure 2 EA improves liver steatosis and liver function in mice (A) H E staining of liver tissue (scale bar = 200 µm). The red arrows indicate typical hepatic inflammation. (B) Liver tissue stained with Oil Red O (scale bar = 200 µm). (C) Morphology of liver. (D) Hepatic TG. (E) Hepatic TC. (F) Serum ALT. (G) Serum AST. n= 6, values are mean ± SEM; *** p < 0.001 (Control vs Model); ## p < 0.01 (Model vs EA); ΔΔ p < 0.01 (EA vs SEA).
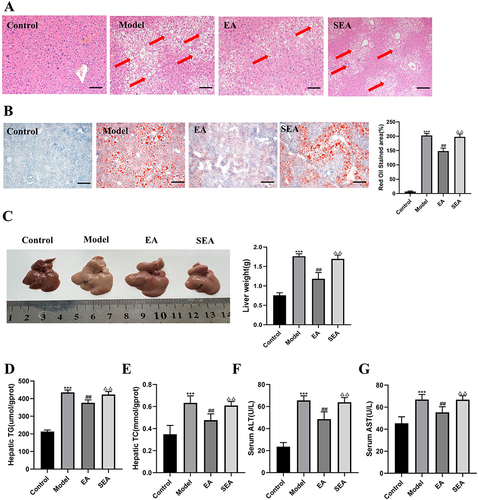
Figure 3 EA improves colonic inflammation and intestinal barrier tight junction structure in obese mice (A) HE staining of colon tissue (scale bar =100 µm). Black arrows indicate typical intestinal inflammation. (B) Electron microscopy of colon tissue (scale bar =40000 µm), The site indicated by the yellow arrow is the tight junction structure. (C) Colon length of mice in each group(D)Colonic TNF-α. (E) Colonic IL-1β. (F) Colonic IL-6. (G) Colonic IL-10. (H) Immunohistochemical analysis of the expression of individual proteins (scale bar = 100 µm). (I) Immunoblot analysis of individual protein expression (β-actin as internal reference). n= 6, values are mean ± SEM; *** p < 0.001 (Control vs Model); ## p < 0.01, ### p < 0.001 (Model vs EA); Δ p < 0.05, ΔΔ p < 0.01, ΔΔΔ p < 0.001 (EA vs SEA).
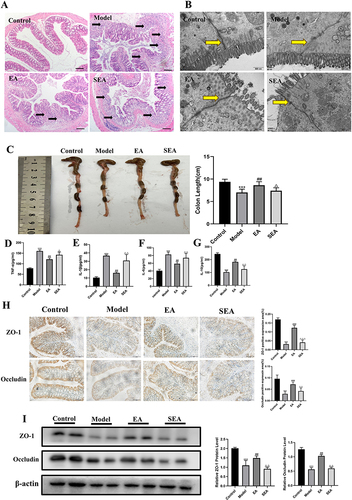
Figure 4 The effects of EA on the Nrf2/HO-1 signaling pathway in COLON tissue. (A) Immunofluorescence of colon tissue (scale bar = 100 µm). (B) Immunoblot analysis of individual protein expression (β-actin as internal reference). n= 4, values are mean ± SEM; ** p < 0.01,*** p < 0.001 (Control vs Model); ## p < 0.01 (Model vs EA); Δ p < 0.05, ΔΔ p < 0.01 (EA vs SEA).
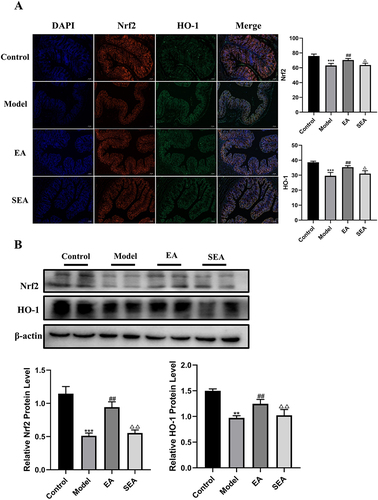
Figure 5 EA ameliorated IBD in obese mice by inhibiting ferroptosis in the gut Gene and protein levels were verified. (A) Gene expression (GAPDH as internal reference). (B) Protein expression (β-actin as internal reference). n = 6, values are mean ± SEM; ** p < 0.01,*** p < 0.001 (Control vs Model); ## p < 0.01, ### p < 0.01 (Model vs EA); Δ p < 0.05, ΔΔ p < 0.01 (EA vs SEA).
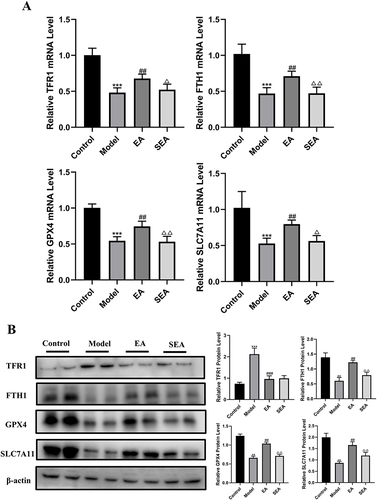
Figure 6 Effect of EA on gut microbiota of mice with high-fat diet (A) Alpha diversity index. (B) PCoA analysis. (C) UPGMA analysis. (D) Species group at phylum level. (E) The relative abundance of Bacteroidetes.(F) The relative abundance of Firmicutes (G)The ratio of Firmicutes to Bacteroidetes. n = 8, values are mean ± SEM; * (Control vs Model), *p < 0.05, ** p < 0.01,*** p < 0.001; ### p < 0.01 (Model vs EA).
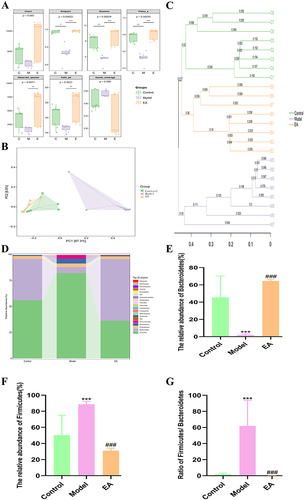
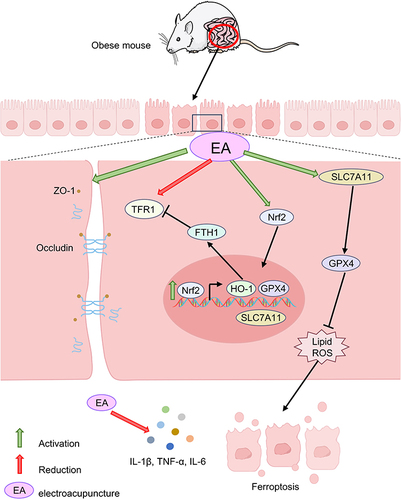
Figure 7 Diagrammatic representation for the mechanism of current explored study.