Figures & data
Table 1 Baseline Characteristics of the T2DM Patients Stratified by Insulin Resistance and Gender
Table 2 Spearmen’s Correlation of CMI Levels with Clinical and Biochemical Parameters
Table 3 Association of the Insulin Resistance with CMI Quartiles
Figure 1 The smooth curve fit for the association between CMI and prevalence of IR. Solid redline represents the smooth curve fit between variables. Blue bands represent the 95% of confidence interval from the fit. Adjusted for: age, BMI, DD, hypoglycemic drugs, SBP, DBP, HbA1c, serum creatinine, serum albumin, uric acid, ALT, AST, GGT, drinking and smoking.
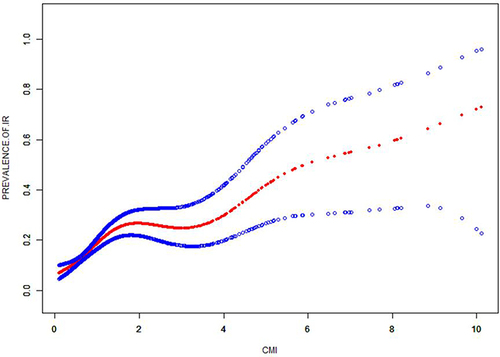
Table 4 Association Between CMI and Insulin Resistance Stratified by Age, BMI and Hypertension
Figure 2 Subgroups analysis for the association between CMI and prevalence of IR by gender, age, BMI and HbA1c level.
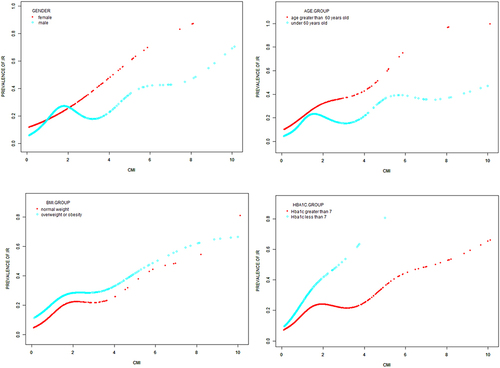
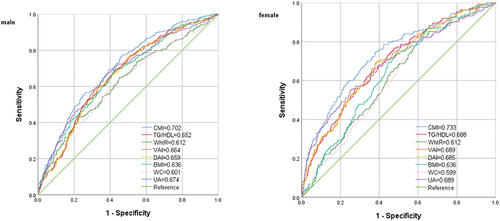
Table 5 The Results of ROC Analysis of CMI, TG/HDL, WHtR, VAI, DAI, BMI, WC and Uric Acid for the Diagnosis of IR
Figure 3 Receiver operating characteristic curves of TG/HDL, WHtR, VAI, DAI, BMI, WC and uric acid to identify IR.