
Figures & data
Table 1 Baseline Characteristics of the Included Studies
Figure 1 Study flowchart diagram.
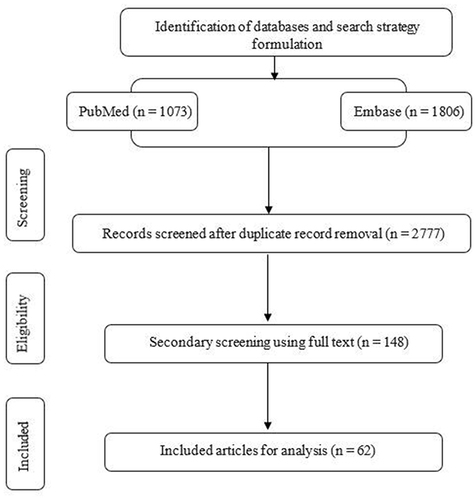
Table 2 Effect Estimates for Efficacy Outcomes (Mean Difference and 95% CI)
Figure 2 Forest plot of efficacy outcomes: (a) change in HbA1c levels from baseline; (b) change in FPG levels from baseline; (c) change in 2h-PPG levels from baseline.
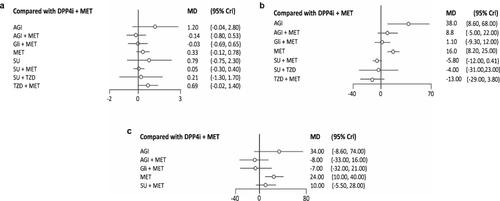
Table 3 Effect Estimates for Safety Outcomes (Risk Ratio and 95% CI)
Figure 3 Forest plot of safety outcomes: (a) serious adverse events; (b) hypoglycemia; (c) gastrointestinal events; (d) cardiovascular events.
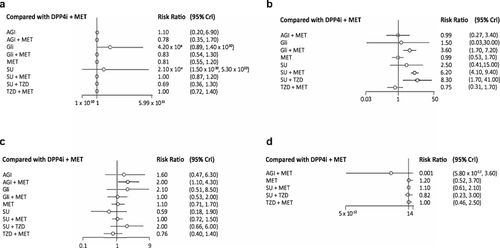
Table 4 Summary Table of the Efficacy and Safety Outcomes of DPP4i + Met Combination with Other OAD-Based Met Combination Drug Classes