Figures & data

Figure 1 Study flow chart.
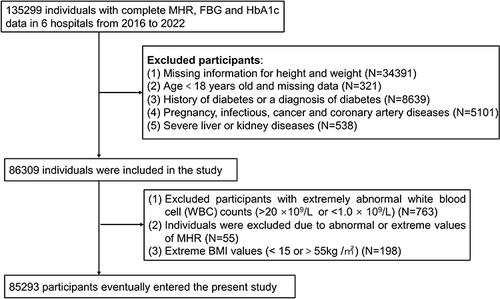
Table 1 Baseline Characteristics of Study Participants
Figure 2 Prevalence of Prediabetes stratified according to MHR categories.
Notes: MHR was divided into quartiles with the following values: Q1 ≤ −0.67; −0.67 < Q2 ≤ −0.52; −0.52 < Q3 ≤ -0.39; Q4 > −0.39.
Abbreviations: MHR, monocyte-to-high-density lipoprotein ratio, MHR value was log10-transformed.
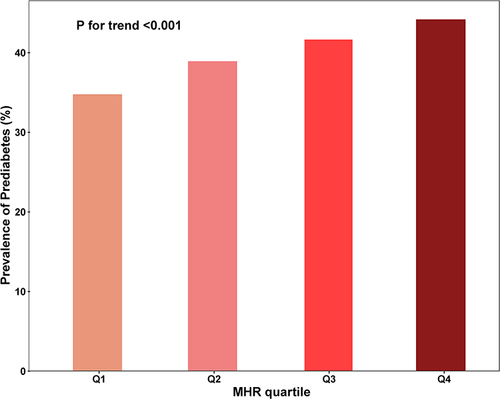
Table 2 The Association Between MHR and Prediabetes
Table 3 Subgroup Analysis for the Association Between MHR and Prediabetes
Table 4 Threshold Effect Analysis of MHR on Prediabetes Using a Two-Piecewise Linear Regression Model
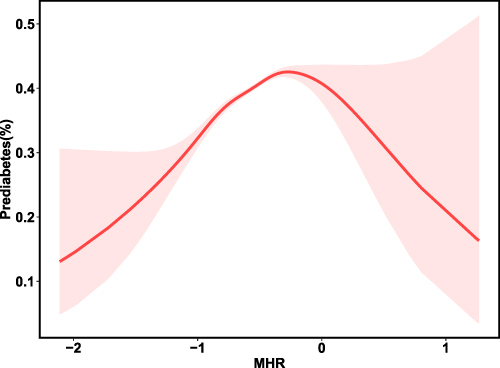
Figure 3 Association between MHR and the prevalence of prediabetes.
Notes: GAM with smooth curve fitting for the nonlinear association between MHR and the prevalence of prediabetes. Adjusted for age, gender, BMI, SBP, DBP, Scr, UA, TG, TC, LDL-C, FPG, WBC.
Abbreviations: MHR, monocyte-to-high-density lipoprotein ratio, MHR value was log10-transformed.