
Figures & data
Figure 1 Flow chart of refugees’ data included in the analysis.
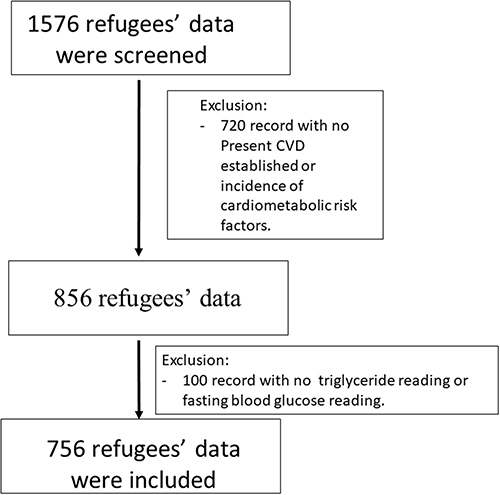
Table 1 Participant Demographics (Frequency (%) or Mean ± SD)
Table 2 Correlation Between Triglyceride Glucose Index, HbA1c%, Fasting Blood Glucose as Well as Fasting Triglyceride with Different Variables
Figure 2 (A) Operational characteristic curve of the ROC for the TyG index to predict ten-year cardiovascular risk as assessed by the FRS in Syrian Refugees (n = 756). (B) Operational characteristic curve of the ROC for the HbA1c to predict ten-year cardiovascular risk as assessed by the FRS in Syrian Refugees (n = 756). (C) Operational characteristic curve of the ROC for the Fasting blood glucose to predict ten-year cardiovascular risk as assessed by the FRS in Syrian Refugees (n = 756). (D) Operational characteristic curve of the ROC for the Fasting triglyceride to predict ten-year cardiovascular risk as assessed by the FRS in Syrian Refugees (n = 756).
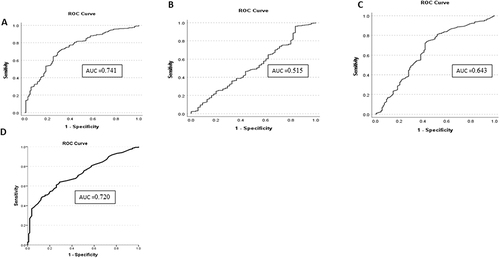
Table 3 Demographic, Smoking Status, Participant Health-Status, and Vitals and Laboratory Tests of the Sample According to TyG Index Categories (n = 756)
Table 4 Logistic Regression Analysis of the Association Between the TyG Index and Framingham Risk Score
Data Sharing Statement
All data generated or analysed during this study are included in this published article.