
Figures & data
Figure 1 Flow chart of study population.
Abbreviations: WC, waist circumference; MRI, magnetic resonance imaging.
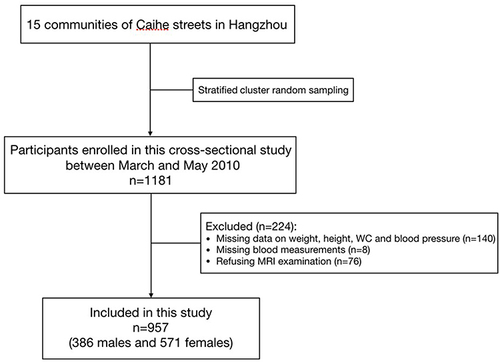
Table 1 Sociodemographic Characteristics, Lifestyle and Metabolic Parameters of the Total Sample and Across MetS Status
Table 2 Prevalence of Metabolic Parameters and MetS According to Physical Activity Levels
Table 3 Prevalence of Metabolic Parameters and MetS According to Sitting Time
Table 4 Odds Ratio for the MetS and Its Components Depending on Physical Activity (or, 95% CI)
Table 5 Odds Ratio for the MetS and Its Components Depending on Sitting Time (or, 95% CI)
Data Sharing Statement
The datasets are not publicly available due institution’s policy but are available from the corresponding author upon reasonable request.