
Figures & data
Table 1 Baseline Demographic and Clinical Characteristics (n = 50)
Table 2 Comparison of the Following Parameters at Different Time Points
Figure 1 (A) Comparison of SFA at different time points. ***P<0.001 (B) Comparison of VFA at different time points. ***P<0.001.
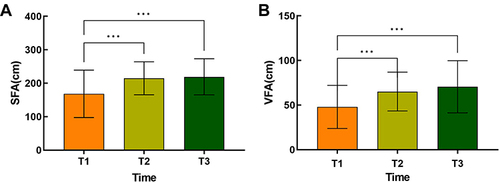
Figure 2 (A) Comparison of FT3 at different time points. ***P<0.001 (B) Comparison of FT4 at different time points. ***P<0.001 (C) Comparison of TSH at different time points. ***P<0.001.
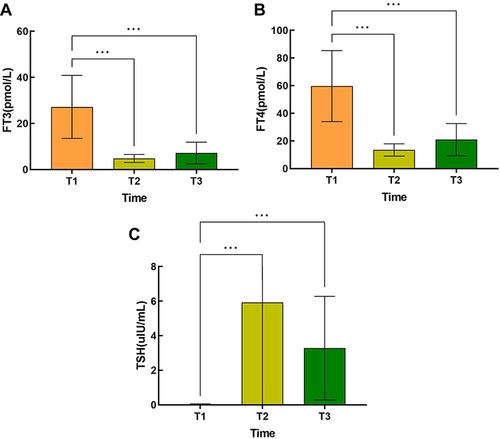
Figure 3 (A) Comparison of TC at different time points. ***P<0.001 (B) Comparison of HDL at different time points. ***P<0.001 *P<0.05 (C) Comparison of LDL at different time points. ***P<0.001 (D) Comparison of TG at different time points. P>0.05.
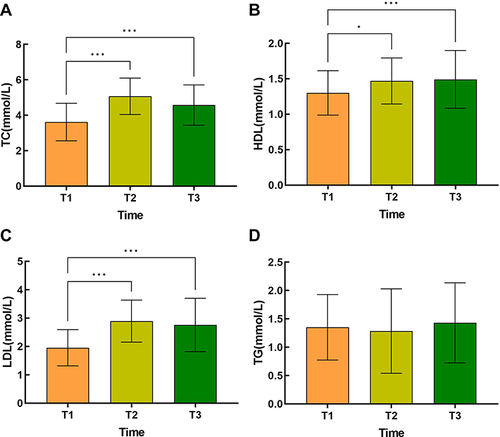
Figure 4 (A) Comparison of body weight at different time points. ***P<0.001 (B) Comparison of neck circumference at different time points. ***P<0.001 (C) Comparison of BMI at different time points. ***P<0.001 (D) Comparison of waist circumference at different time points. ***P<0.001.
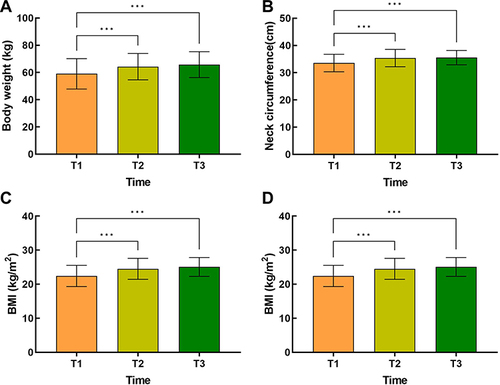
Figure 5 Comparison of methimazole dose at different time points. ***P<0.001.
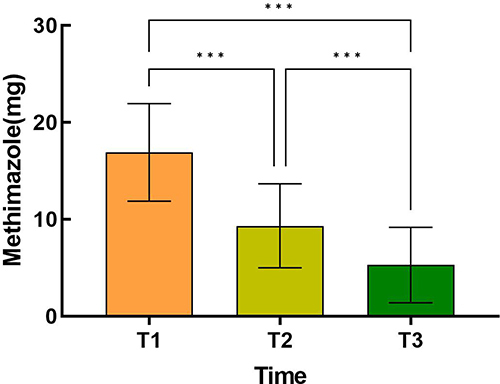
Table 3 The Effects of Thyroid Hormones and Lipids on VFA and SFA Were Summarized by a Linear Mixed-Effect Model
Table 4 The Effects of Methimazole Dose on VFA and SFA Were Summarized by a Linear Mixed-Effect Model
Table 5 The Effects of Thyroid Hormones on Blood Lipids Were Summarized by a Linear Mixed-Effect Model