Figures & data
Table 1 Comparison of Baseline Characteristics and Laboratory-Related Indicators Between T2DM Patients with and without Vitamin D Deficiency
Figure 1 Comparison of apo B/A1 between T2DM patients with and without vitamin D deficiency.
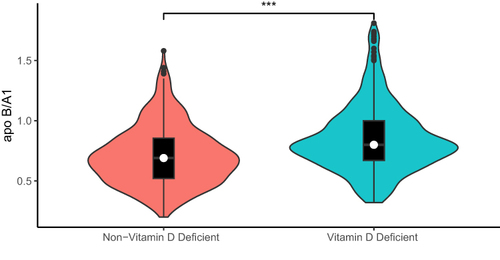
Table 2 Comparison of Baseline Characteristics and Laboratory-Related Indicators Between High-and Low-apo B/A1 Groups
Figure 2 Comparison of VitD levels between high- and low-apo B/A1 groups.
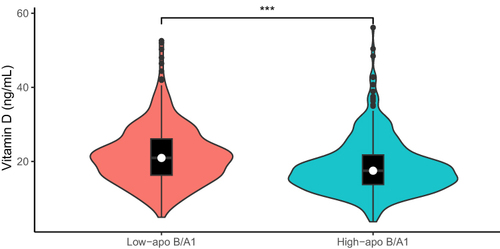
Table 3 Correlation Between VitD and Various Indicators
Table 4 Correlation Between apo B/A1 and Various Indicators
Table 5 Linear Regression Analysis of apo B/A1 and VitD
Figure 3 Linear regression analysis of apo B/A1 and VitD.
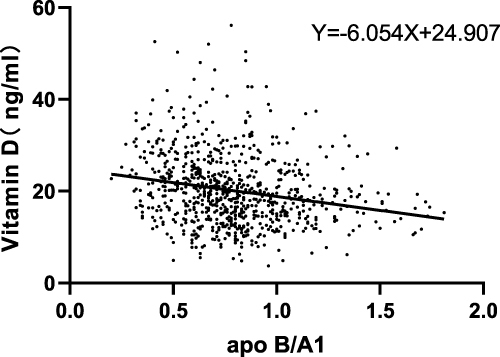
Table 6 Linear Regression Analysis of Multiple Factors and VitD
Table 7 Binary Logistic Regression Model
Figure 4 Nonlinear relationship between vitamin D deficiency and apo B/A1 in T2DM patients.
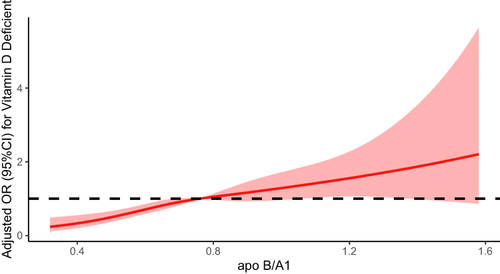
Figure 5 Nonlinear relationship between vitamin D deficiency and apo B/A1 after gender stratification in T2DM patients.
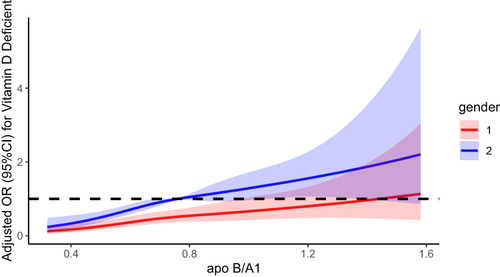
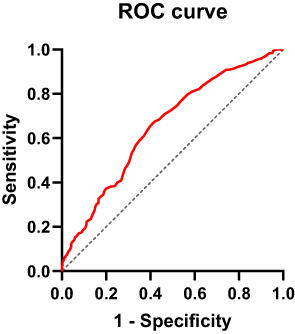
Table 8 Diagnostic Value of apo B/A1 in Vitamin D Deficiency Patients with T2DM
Figure 6 ROC curve of apo B/A1.