
Figures & data
Figure 1 Flow chart of animal experiment.
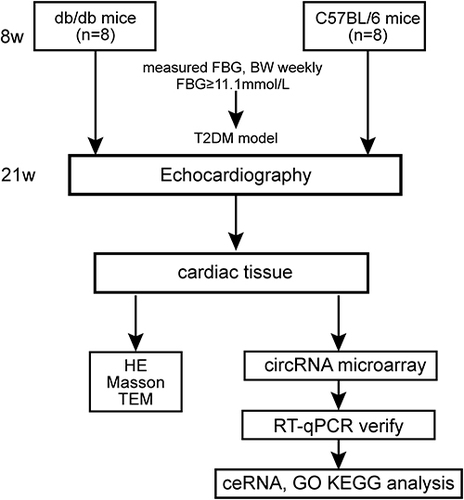
Table 1 The Sequences of Primers of Verified circRNAs
Figure 2 Establishment of db/db DCM mouse model. (A) Heart weight/tibia length ratio, body weight, and fasting blood glucose and insulin levels of the db/db and control mice (n = 8). (B) Cardiac tissue was stained with H & E (bar = 20 μm). (C) Masson’s trichrome stain in cardiac tissue and collagen fraction (blue, arrow) (bar = 50 μm). (D) Myocardial tissue and mitochondria under electron microscopy (bar = 5.0 μm). Z fibrils (arrow in NC group), collagen deposition (arrow in DCM group). (B–D) n = 3, ***P < 0.001.
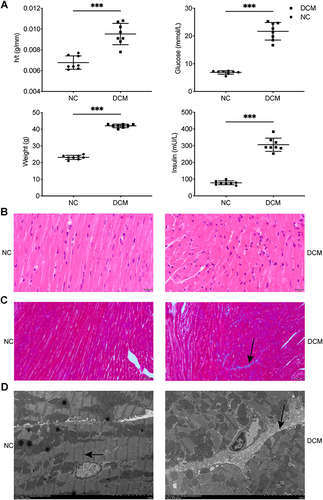
Figure 3 Changes of cardiac structure and function in DCM mice. (A) Representative pictures of echocardiography. (B) Echocardiogram measurements (LVIDd, LVIDs, EF, FS, E/A, E/e′) of the DCM and NC groups. n = 3, *p < 0.05, **p < 0.01, ***p < 0.001.
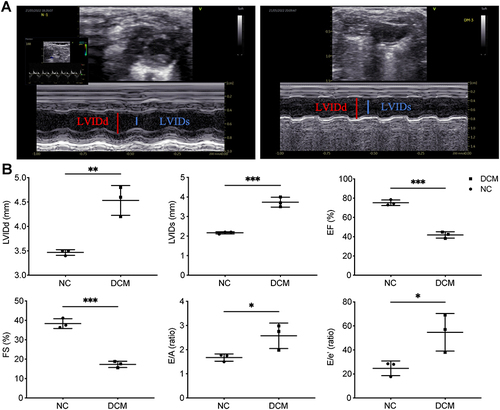
Table 2 Differentially Expressed circRNAs in Myocardial Tissues Based on Fold Change
Figure 4 Overview of the detected circRNAs. (A) Distribution of differentially expressed circRNAs in chromosomes between the two groups. Upregulated (red) and downregulated circRNAs (green) in the DCM group vs NC group. (B) Hierarchical cluster analysis (heatmap) of differentially expressed circRNAs between the NC and DCM groups. (C) CircRNA volcano plots. The vertical lines correspond to 1.5-fold up and down, respectively, and the horizontal line represents a P-value of 0.05. The red point in the plot represents the differentially expressed circRNAs with statistical significance. (D) Some representative differentially expressed circRNAs were verified by RT-qPCR. n = 3; circRNA, circular RNA. circPHF20L1, mmu_circRNA_28667; circGDA, mmu_circRNA_32303; circCLASP1, mmu_circRNA_20674; circSYNJ2BP, mmu_circRNA_25425; circSLC8A1, mmu_circRNA_014302; circPMS1, mmu_circRNA_001535; circMKLN1, mmu_circRNA_005522; circHIPK3, mmu_circRNA_013422.
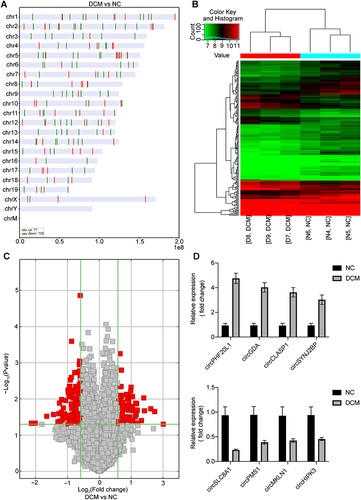
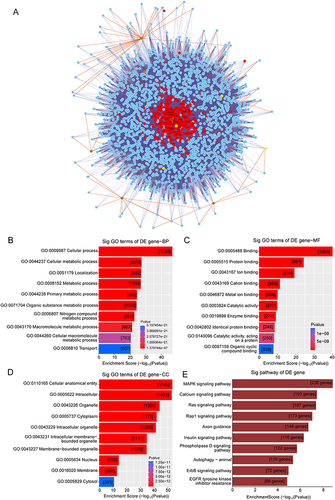
Figure 5 CeRNA network and functional analysis. (A) The ceRNA network was predicted by an online bioinformatics program. The top six upregulated circRNAs, and the top four downregulated circRNAs that were indexed by the circBase database, are shown. Nodes with red color are microRNAs, nodes with light-blue color are protein coding RNAs, nodes with brown color are up-circular RNAs, nodes with yellow color are down-circular RNAs. Edges with T-shape arrow represent directed relationships, edges without arrow represent undirected relationships (ceRNA relationship). (B–E) Differentially expressed circRNAs in the DCM group as indicated by GO and KEGG analyses.
Data Sharing Statement
CircRNA microarray data reported in this paper have been uploaded to NCBI and are publicly accessible at GSE239970.