Figures & data
Table 1 Initial clinical and anamnestic characteristics of patients, n (%)
Table 2 Revascularization and drug therapy during follow-up
Table 3 Basal and postprandial glucose, insulin and C-peptide levels on the 1st and 12th days from the Ml
Table 4 Basal level of FFA and PAI-1, on the 1st and 12th days from the MI, respectively
Figure 1 Correlation between postprandial insulin and FFA levels.
Abbreviation: FFA, free fatty acid.
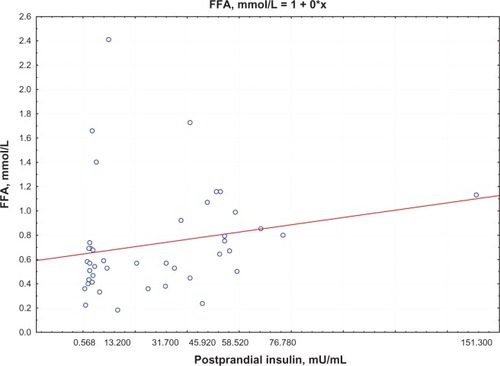
Figure 2 Correlation between QUICKI index and FFA levels.
Abbreviations: FFA, free fatty acid; QUICKI, Quantitative Insulin Sensitivity Check Index.
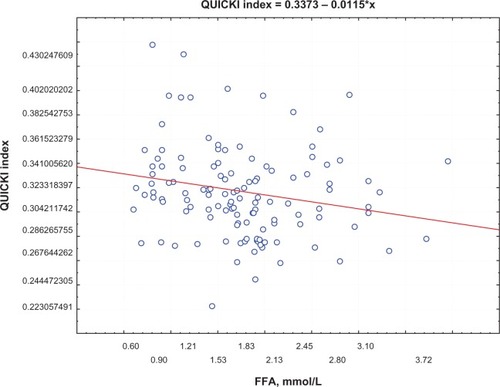
Figure 3 Correlation between QUICKI index and PAI levels.
Abbreviations: PAI, plasminogen activator inhibitor; QUICKI, Quantitative Insulin Sensitivity Check Index.
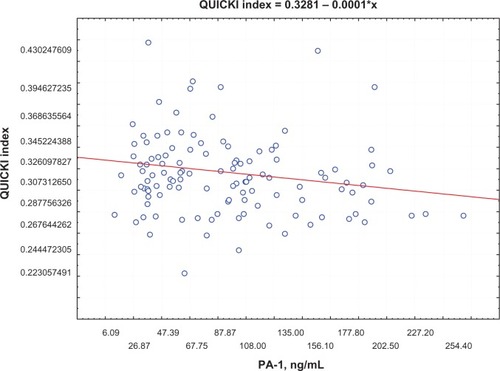
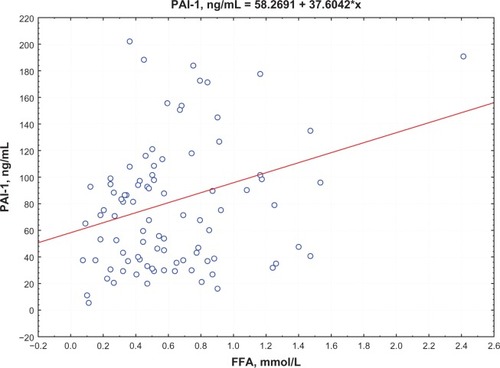
Figure 4 Correlation between FFA and PAI levels.
Abbreviations: FFA, free fatty acid; PAI-, plasminogen activator inhibitor-1