Figures & data
Figure 1 Flow chart of the study protocol.
Abbreviation: n, number of subjects.
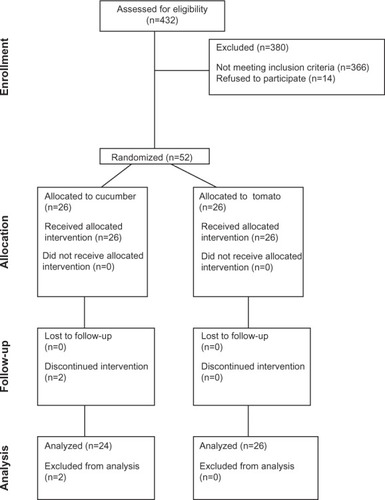
Table 1 Characteristics of the population studied
Table 2 Effect of tomato consumption on lipid profile and anthropometric measurements
Figure 2 Correlation between the change in HDL-C levels and the number of days reported with complete adherence to cucumber (control group) or tomato consumption.
Note: Dotted lines represent a 95% confidence interval.
Abbreviation: HDL-C, high-density lipoprotein cholesterol.
Abbreviation: HDL-C, high-density lipoprotein cholesterol.
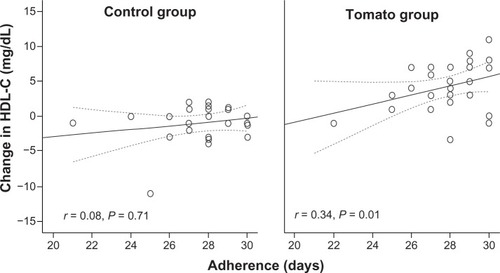
Figure 3 Change in HDL-C after tomato or cucumber consumption.
Notes: (A) Change in HDL-C levels according to days of adherence. The number of subjects is described in . (B) Change in HDL-C levels for every case studied (Student’s t-test, P < 0.0001).
Abbreviations: HDL-C, high-density lipoprotein cholesterol; n, number of subjects.
Abbreviations: HDL-C, high-density lipoprotein cholesterol; n, number of subjects.
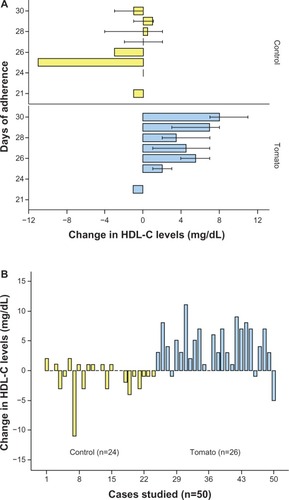
Table 3 Linear regression model to evaluate the independent parameters associated with the increment of HDL-C
Table S1 Clinical and nutritional characteristics of the population studied throughout the study