Figures & data
Figure 1 Flow diagram of review and inclusion/exclusion (Preferred Reporting Items for Systematic reviews and Meta-Analyses [PRISMA]).
Notes: aData of interest = incidence or prevalence of hypertension and/or obesity among adults with T2DM (searches one and two) or risk association of hypertension/obesity with long-term micro- or macrovascular complications of T2DM (search one only); bdoes not exclude patients hospitalized with T2DM complications; cpublication types excluded were commentaries, case studies, interim reports when end-of-study data were available, and reviews for which primary data were already included; done article (Thomas and AtkinsCitation29) reported on two studies, for a total of 78 studies in 77 articles.
Abbreviations: NHS EED, National Health Service Economic Evaluation Database; T2DM, type 2 diabetes mellitus.
Abbreviations: NHS EED, National Health Service Economic Evaluation Database; T2DM, type 2 diabetes mellitus.
![Figure 1 Flow diagram of review and inclusion/exclusion (Preferred Reporting Items for Systematic reviews and Meta-Analyses [PRISMA]).](/cms/asset/3dfe0653-d09b-44c5-b1cc-cd9e8e161d3e/dmso_a_51325_f0001_c.jpg)
Figure 2 Hypertension (HTN) prevalence rates among patients with type 2 diabetes mellitus.
Notes: Superscript numbers correspond to reference numbers. For countries with more than one reference citation, the citations are provided in the following order: study presenting the low estimate; study presenting the high estimate; and, if applicable, study or studies presenting mid-range value(s). Mid-range values are not shown in the figure. aMean ages in the study by Hassing et alCitation59 were 83.1–84.0 years; bSuh et alCitation76 provided both low and high estimates; cThomas and AtkinsCitation29 provided both low and high estimates (two studies in one report); dthe low estimate in South America used an atypical definition of hypertension (the proportion of patients with systolic blood pressure >144 mmHg).Citation82
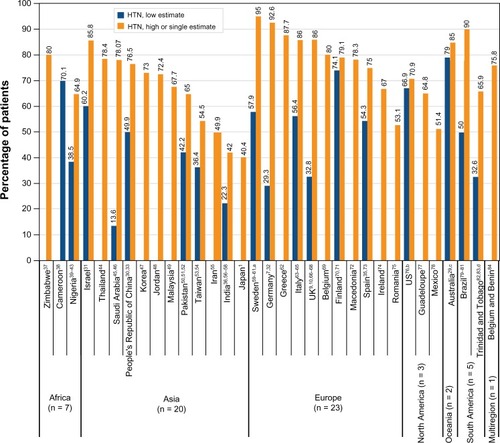
Figure 3 Prevalence of obesity defined by body mass index (BMI) among patients with type 2 diabetes mellitus.
Notes: Superscript numbers correspond to reference numbers. For countries with more than one reference citation, the citations are provided in the following order: study presenting the low estimate; study presenting the high estimate; and, if applicable, study or studies presenting mid-range value(s). Mid-range values are not shown in the figure. aThomas and AtkinsCitation29 provided both low and high estimates (two studies in one report).
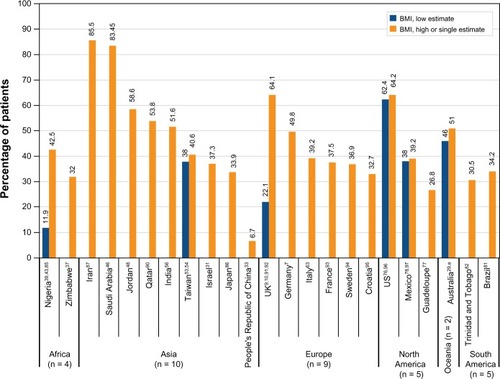
Figure 4 Prevalence of obesity defined by waist circumference (WC) among patients with type 2 diabetes mellitus.
Notes: Superscript numbers correspond to reference numbers. For countries with more than one reference citation, the citations are provided in the following order: study presenting the low estimate; study presenting the high estimate. aKoehler et alCitation32 provided both low and high estimates; bBosevski et alCitation72 provided both low and high estimates.
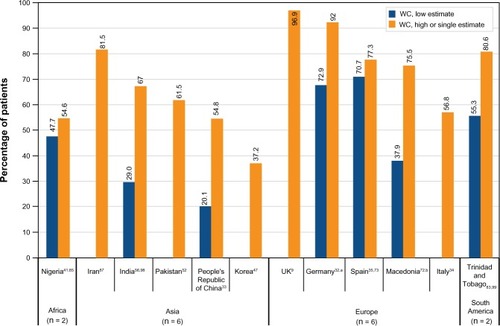
Table 1 Prevelence (%) of body mass index (BMI) classes of obesity
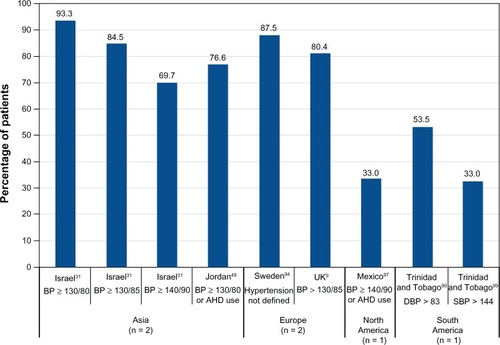
Figure 5 Prevalence of hypertension among obese adults with type 2 diabetes mellitus.
Abbreviations: AHD, antihypertensive drug; BP, blood pressure; DBP, diastolic blood pressure; SBP, systolic blood pressure.