Figures & data
Table 1 Characteristics of the study population
Table 2 Linear regression examining insulin resistance and vitamin D in males and females
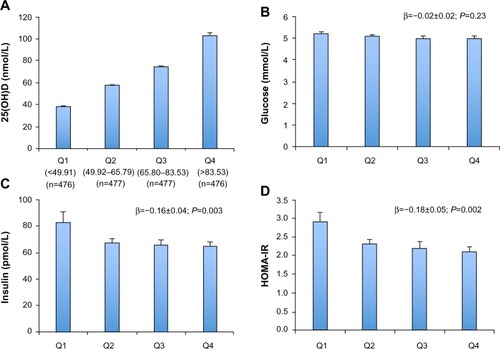
Figure 1 Insulin resistance and related markers by quartile of vitamin D.
Notes: Values are crude means ± SE for each 25(OH)D (weighted). Quartiles of 25(OH)D (Q1–Q4) are depicted in panel (A), together with the range and the number of subjects in each quartile. Regression coefficient (β), SE, and P-values for the linear relationship between 25(OH)D and glucose (B), insulin (C), and HOMA-IR (D) are adjusted for sex, waist circumference, physical activity, season, and hormone drug use (in women). Insulin resistance factors were natural log-transformed for analysis.
Abbreviations: SE, standard error; Q, quartile; HOMA-IR, homeostatic model assessment–insulin resistance; 25(OH)D, plasma 25-hydroxyvitamin D.
Abbreviations: SE, standard error; Q, quartile; HOMA-IR, homeostatic model assessment–insulin resistance; 25(OH)D, plasma 25-hydroxyvitamin D.