
Figures & data
Table 1 Anthropometric and metabolic characteristics of the study population
Table 2 Variation in the prevalence of metabolic syndrome by sex and age group in the entire population
Figure 1 Variation in the prevalence of metabolic syndrome by sex and age group in the total population.
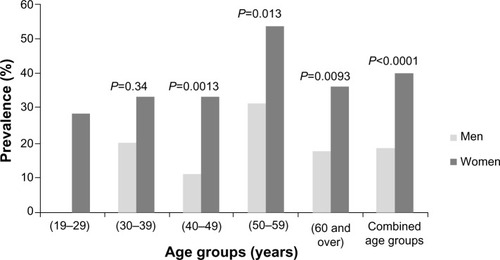
Table 3 Variation in the frequency (%) of risk factors associated with metabolic syndrome by sex and age group in the population
Table 4 Distribution (%) of the number of risk factors associated with metabolic syndrome by sex and age group in the population