Figures & data
Figure 1 Jejunum basal Isc. (A) Average raw trace data of recordings of basal Isc (μA/cm2), from freshly isolated jejunum, recorded from time 0–20 minutes. (B) Average steady state basal Isc (at time =20 minutes), from lean mice (open bar) and ob/ob mice (solid black bar).
Abbreviations: Isc, transepithelial short circuit current; SEM, standard error of the mean; ob/ob, leptin-deficient.
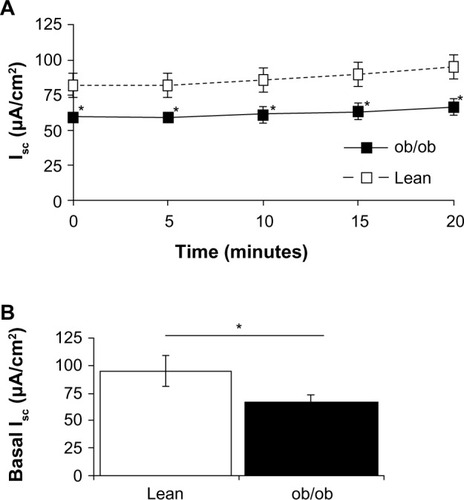
Figure 2 Effect of pharmacological inhibitors on the basal jejunum Isc. (A) Average initial steady state basal Isc (pre) and resulting basal Isc 15 minutes after bilateral application of 100 μM clotrimazole (post), in lean (open bars) and ob/ob (solid bars) mice. (B) Percent inhibition of basal Isc by clotrimazole (100 μM, bilateral), on lean (open bars) and ob/ob mice (solid black bar). (C) Average initial steady state basal Isc (pre) and resulting basal Isc 15 minutes after bilateral application of 200 μM DIDS (post), in lean (open bars) and ob/ob (solid bars) mice. (D) Percent inhibition of basal Isc by DIDS (200 μM, bilateral), on lean (open bars) and ob/ob mice (solid black bar). (E) Average initial steady state basal Isc (pre) and resulting basal Isc 15 minutes after basolateral application of 100 μM ouabain (post), in lean (open bars) and ob/ob (solid bars) mice. (F) Percent inhibition of basal Isc by ouabain (100 μM, basolateral), on lean (open bars) and ob/ob mice (solid black bar).
Abbreviations: DIDS, 4,4′-diisothiocyanatostilbene-2,2′-disulfonic acid disodium salt hydrate; Isc, transepithelial short circuit current; SEM, standard error of the mean; ob/ob, leptin-deficient.
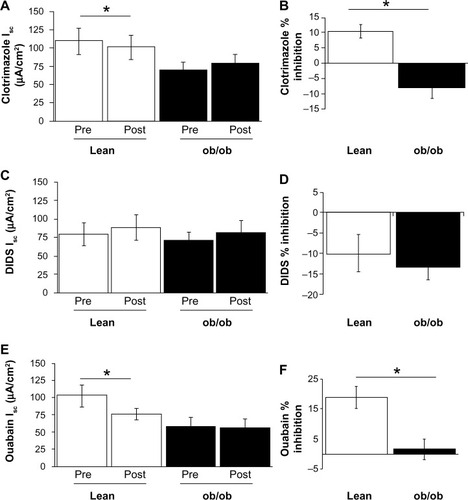
Table 1 The effects of the obese diabetic state on jejunum morphology
Figure 3 Representative H&E stained sections from jejunum. (A) Lean control mouse jejunum. (B) ob/ob mouse jejunum.
Abbreviations: H&E, hematoxylin and eosin; ob/ob, leptin-deficient.
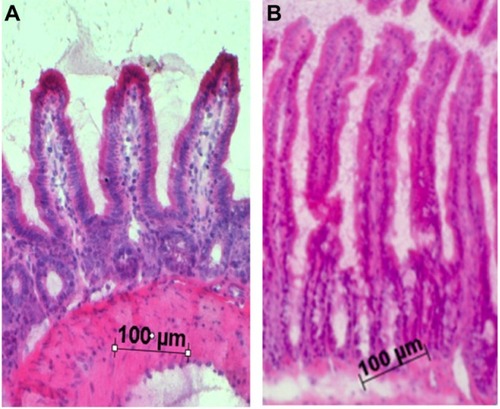
Figure 4 Total CFTR protein expression in murine jejunum. Typical Western blot demonstrating CFTR and GAPDH expression in jejunum from two samples, from both ob/ob and lean mice. CFTR and GAPDH bands were observed at ~170 KDa and 37 KDa, respectively.
Abbreviations: CFTR, cystic fibrosis transmembrane conductance regulatory protein; GAPDH, glyceraldehyde-3-phosphate dehydrogenase; SEM, standard error of the mean; ob/ob, leptin-deficient.
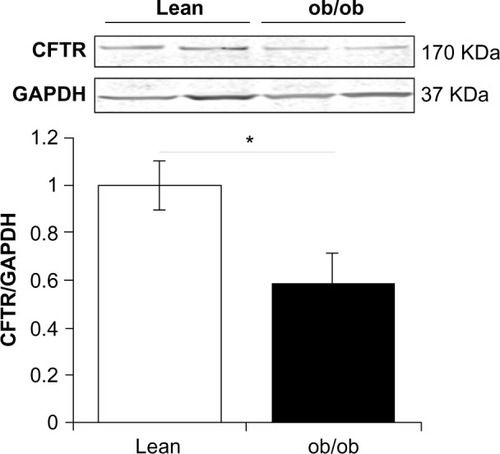
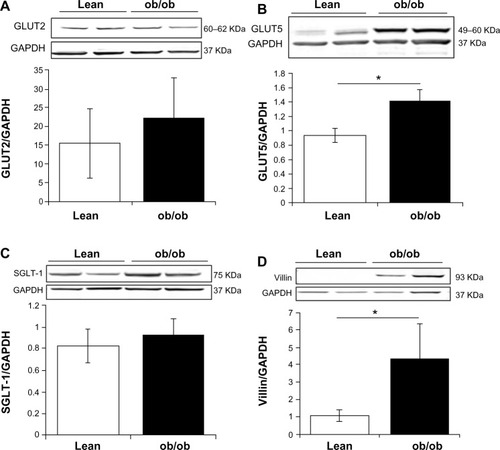
Figure 5 Total GLUT2, GLUT5, SGLT-1, and Villin protein expression in murine jejunum. (A) Typical Western blot demonstrating GLUT2 expression (normalized to GAPDH) in jejunum from two samples from both ob/ob and lean mice. GLUT2 and GAPDH bands were observed at 60–62 KDa and 37 KDa, respectively. Average GLUT2/GAPDH ratio comparing ob/ob (solid bar) and lean (open bar) murine jejunum. (B) Typical Western blot demonstrating GLUT5 expression (normalized to GAPDH) in jejunum from two samples from both ob/ob and lean mice. GLUT5 and GAPDH bands were observed at 49–60 KDa and 37 KDa, respectively. Average GLUT5/GAPDH ratio comparing ob/ob (solid bar) and lean (open bar) murine jejunum. (C) Typical Western blot demonstrating SGLT-1 expression (normalized to GAPDH) in jejunum from two samples from both ob/ob and lean mice. SGLT-1 and GAPDH bands were observed at 75 KDa and 37 KDa, respectively. Average SGLT-1/GAPDH ratio comparing ob/ob (solid bar) and lean (open bar) murine jejunum. (D) Typical Western blot demonstrating Villin expression (normalized to GAPDH) in jejunum from two samples from both ob/ob and lean mice. Villin and GAPDH bands were observed at 93 KDa and 37 KDa, respectively. Average Villin/GAPDH ratio comparing ob/ob (solid bar) and lean (open bar) murine jejunum. Values are expressed as mean ± SEM (n=15–20). *Denotes significant difference from leans (P<0.05).