
Figures & data
Table 1 Comparisons of baseline characteristics in the two groups
Table 2 Comparisons of the differentiation of each clinical parameter after 6 months in the two groups
Figure 1 (A) Changes in cardio-ankle vascular index (CAVI) before and after 6 months of pioglitazone therapy. Data are presented as the mean ± standard error of the mean **P<0.01 versus 0 month, paired t-test. (B) Changes in CAVI before and after 6 months of glimepiride therapy. Data are presented as the mean ± standard error of the mean. (C) Changes in CAVI after 6 months of pioglitazone or glimepiride therapy. The closed bar denotes the pioglitazone group and the open bar denotes the glimepiride group. Data are presented as the mean ± standard error of the mean. Δ indicates the difference between the value at baseline and the value after 6 months. *P<0.05 versus glimepiride group, unpaired t-test.
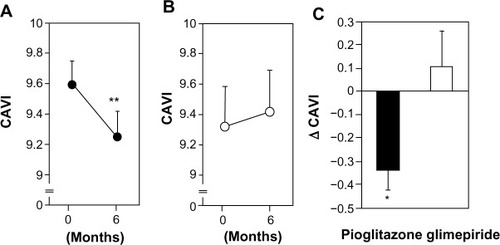
Table 3 Correlation between change in CAVI and changes in various parameters after 6 months in all subjects