Figures & data
Figure 1 Body weight and food intake with salsalate treatment.
Note: (A) Body weights and (B) food intake normalized to body weight as a function of age in GK and WIS rats with and without salsalate treatment.
Abbreviations: GK, Goto-Kakizaki; GK-C, GK rats with standard diet; GK-S, GK rats with salsalate-containing diet; WIS, Wistar; WIS-C, WIS rats with standard diet; WIS-S, WIS rats with salsalate-containing diet.
Abbreviations: GK, Goto-Kakizaki; GK-C, GK rats with standard diet; GK-S, GK rats with salsalate-containing diet; WIS, Wistar; WIS-C, WIS rats with standard diet; WIS-S, WIS rats with salsalate-containing diet.
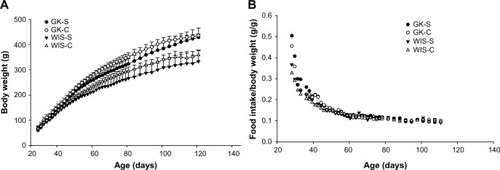
Figure 2 Profiles of blood glucose with salsalate treatment.
Notes: The progression of changes in blood glucose with age in control and salsalate-treated animals. Symbols represent means and error bars one standard deviation of the mean. Colored lines indicate confidence intervals.
Abbreviations: GK, Goto-Kakizaki; GK-C, GK rats with standard diet; GK-S, GK rats with salsalate-containing diet; WIS, Wistar; WIS-C, WIS rats with standard diet.
Abbreviations: GK, Goto-Kakizaki; GK-C, GK rats with standard diet; GK-S, GK rats with salsalate-containing diet; WIS, Wistar; WIS-C, WIS rats with standard diet.
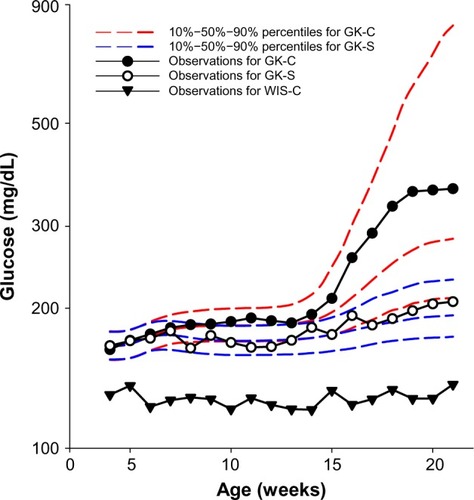
Figure 3 Plasma insulin with salsalate treatment.
Notes: Insulin concentrations in plasma taken at sacrifice measured by enzyme-linked immunosorbent assay. Histograms represent means and error bars one standard deviation of the mean. **P<0.01.
Abbreviations: GK, Goto-Kakizaki; GK-C, GK rats with standard diet; GK-S, GK rats with salsalate-containing diet; WIS, Wistar; WIS-C, WIS rats with standard diet; WIS-S, WIS rats with salsalate-containing diet.
Abbreviations: GK, Goto-Kakizaki; GK-C, GK rats with standard diet; GK-S, GK rats with salsalate-containing diet; WIS, Wistar; WIS-C, WIS rats with standard diet; WIS-S, WIS rats with salsalate-containing diet.
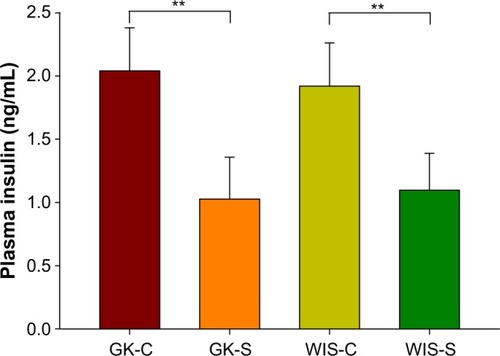
Figure 4 Plasma lipids with salsalate treatment.
Notes: (A) Total cholesterol and (B) triglyceride concentrations in sacrifice plasma in GK and WIS rats treated with and without salsalate treatment. Histograms represent means and error bars one standard deviation of the mean. *P<0.05; **P<0.01.
Abbreviations: GK, Goto-Kakizaki; GK-C, GK rats with standard diet; GK-S, GK rats with salsalate-containing diet; WIS, Wistar; WIS-C, WIS rats with standard diet; WIS-S, WIS rats with salsalate-containing diet.
Abbreviations: GK, Goto-Kakizaki; GK-C, GK rats with standard diet; GK-S, GK rats with salsalate-containing diet; WIS, Wistar; WIS-C, WIS rats with standard diet; WIS-S, WIS rats with salsalate-containing diet.
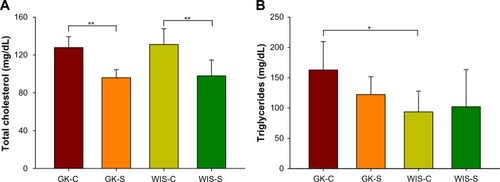
Figure 5 Plasma adiponectin and adiponectin mRNA with salsalate treatment.
Notes: (A) Plasma adiponectin concentrations measured by enzyme-linked immunosorbent assay in sacrifice plasma and (B) adiponectin mRNA measured by qRTPCR in adipose tissue samples taken at sacrifice from GK and WIS rats treated with and without salsalate treatment. Histograms represent means and error bars one standard deviation of the mean. **P<0.01.
Abbreviations: GK, Goto-Kakizaki; GK-C, GK rats with standard diet; GK-S, GK rats with salsalate-containing diet; qRTPCR, quantitative reverse transcription polymerase chain reaction; WIS, Wistar; WIS-C, WIS rats with standard diet; WIS-S, WIS rats with salsalate-containing diet; mRNA, messenger RNA.
Abbreviations: GK, Goto-Kakizaki; GK-C, GK rats with standard diet; GK-S, GK rats with salsalate-containing diet; qRTPCR, quantitative reverse transcription polymerase chain reaction; WIS, Wistar; WIS-C, WIS rats with standard diet; WIS-S, WIS rats with salsalate-containing diet; mRNA, messenger RNA.
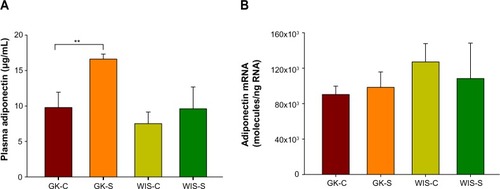
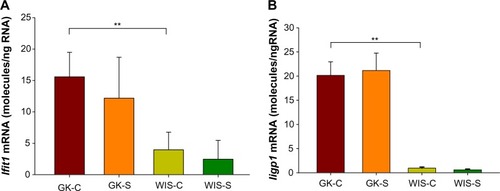
Figure 6 Expression of genes reflecting inflammation in adipose tissue with salsalate treatment.
Notes: (A) Ifit1 and (B) Iigp1 mRNA measured by qRTPCR in adipose tissue samples taken at sacrifice from GK and WIS rats treated with and without salsalate treatment. Histograms represent means and error bars one standard deviation of the mean. *P<0.05; **P<0.01.
Abbreviations: GK, Goto-Kakizaki; GK-C, GK rats with standard diet; GK-S, GK rats with salsalate-containing diet; qRTPCR, quantitative reverse transcription polymerase chain reaction; WIS, Wistar; WIS-C, WIS rats with standard diet; WIS-S, WIS rats with salsalate-containing diet; mRNA, messenger RNA.
Abbreviations: GK, Goto-Kakizaki; GK-C, GK rats with standard diet; GK-S, GK rats with salsalate-containing diet; qRTPCR, quantitative reverse transcription polymerase chain reaction; WIS, Wistar; WIS-C, WIS rats with standard diet; WIS-S, WIS rats with salsalate-containing diet; mRNA, messenger RNA.
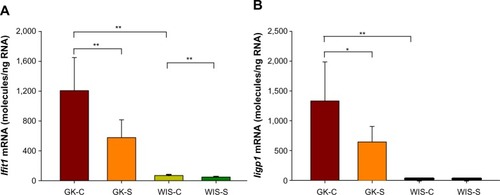
Figure 7 Expression of genes reflecting inflammation in liver tissue with salsalate treatment.
Notes: (A) Ifit1 and (B) Iigp1 mRNA measured by qRTPCR in liver tissue samples taken at sacrifice from GK and WIS rats treated with and without salsalate treatment. Histograms represent means and error bars one standard deviation of the mean. **P<0.01.
Abbreviations: GK, Goto-Kakizaki; GK-C, GK rats with standard diet; GK-S, GK rats with salsalate-containing diet; qRTPCR, quantitative reverse transcription polymerase chain reaction; WIS, Wistar; WIS-C, WIS rats with standard diet; WIS-S, WIS rats with salsalate-containing diet; mRNA, messenger RNA.
Abbreviations: GK, Goto-Kakizaki; GK-C, GK rats with standard diet; GK-S, GK rats with salsalate-containing diet; qRTPCR, quantitative reverse transcription polymerase chain reaction; WIS, Wistar; WIS-C, WIS rats with standard diet; WIS-S, WIS rats with salsalate-containing diet; mRNA, messenger RNA.
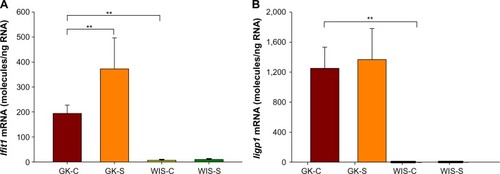
Figure 8 Expression of genes reflecting inflammation in muscle tissue with salsalate treatment.
Notes: (A) Ifit1 and (B) Iigp1 mRNA measured by qRTPCR in muscle tissue samples taken at sacrifice from GK and WIS rats treated with and without salsalate treatment. Histograms represent means and error bars one standard deviation of the mean. **P<0.01.
Abbreviations: GK, Goto-Kakizaki; GK-C, GK rats with standard diet; GK-S, GK rats with salsalate-containing diet; qRTPCR, quantitative reverse transcription polymerase chain reaction; WIS, Wistar; WIS-C, WIS rats with standard diet; WIS-S, WIS rats with salsalate-containing diet; mRNA, messenger RNA.
Abbreviations: GK, Goto-Kakizaki; GK-C, GK rats with standard diet; GK-S, GK rats with salsalate-containing diet; qRTPCR, quantitative reverse transcription polymerase chain reaction; WIS, Wistar; WIS-C, WIS rats with standard diet; WIS-S, WIS rats with salsalate-containing diet; mRNA, messenger RNA.