Figures & data
Table 1 Baseline and postprogram characteristics of the MAO and MA-NO phenotype groups who transitioned to metabolically healthy (values are mean ± standard deviation)
Table 2 Baseline and postprogram characteristics of the obese and nonobese phenotypes who did not transition (values are mean ± standard deviation)
Figure 1 Changes in point prevalence of metabolic syndrome risk factors before and after community exercise in the metabolically abnormal obese participants who transitioned to a metabolically healthy obese phenotype (A), and metabolically abnormal nonobese participants who transitioned to a metabolically healthy nonobese phenotype (B).
Abbreviations: HDL, high-density lipoprotein; LDL, low-density lipoprotein.
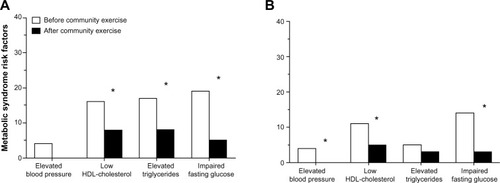
Figure 2 The odds of transition from the metabolically abnormal obese (MAO) phenotype to the metabolically healthy obese (MHO) phenotype across quartiles of increased relative energy expenditure (top panel) and increased cardiorespiratory fitness (bottom panel) adjusted for age and sex.
Abbreviation: VO2 max, maximal oxygen uptake.
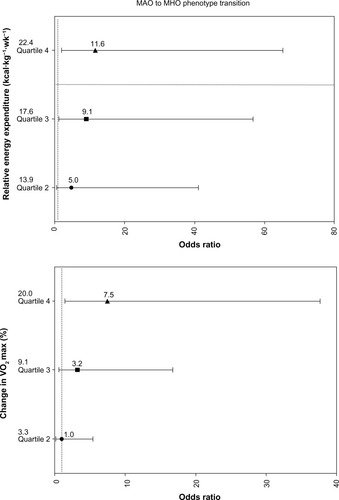
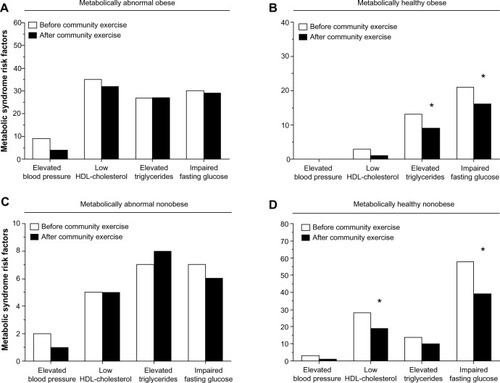
Figure 3 Changes in point prevalence of metabolic syndrome risk factors before and after community exercise in the metabolically abnormal obese (A), metabolically healthy obese (B), metabolically abnormal nonobese (C), and metabolically healthy nonobese (D) subgroups who did not transition.
Abbreviations: HDL, high-density lipoprotein; LDL, low-density lipoprotein.