
Figures & data
Figure 1 Proportion of individuals from C8 Health Project and NHANES data by BMI percentile. The proportion of individuals within each BMI percentile from the NHANES and C8 populations were plotted in an overlaid histogram. The bottom area of each bar shaded darkest gray is where the two populations overlap. The top portion of each bar that is a lighter gray is the proportion that is greater among the C8 population, and the lightest gray is the proportion that is greater among the NHANES population.
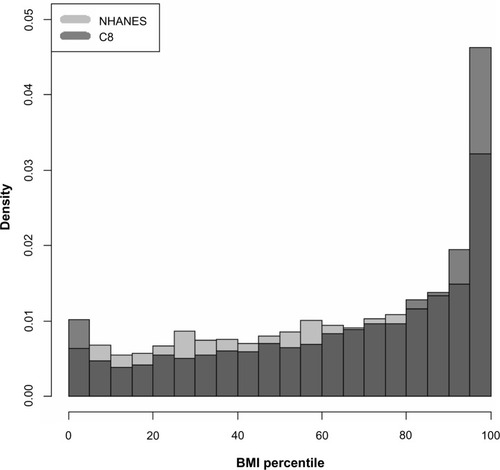
Table 1 Characteristics of population by BMI category, mean (SEM) or n (%), adjusted for age
Table 2 Correlations with C8 (Spearman rank correlation coefficient)
Table 3 Characteristics of population by metabolic syndrome, mean (SEM), adjusted for age
Table 4 C8 and NHANES population comparisons, mean (95% CLM) or percent (95% confidence interval)