Figures & data
Table 1 Primer sequences (5′–3′) for quantitative real-time PCR
Table 2 Gain, carcass traits, and body composition of lambs infused with varying levels of palmitoleic (C16:1) acid
Table 3 Serum fatty acid content from lambs infused with varying levels of palmitoleic (C16:1) acid
Figure 1 Effects of palmitoleic acid infusion on serum cis-11 vaccenic acid levels.
Abbreviations: LW, lipid weight; d, days.
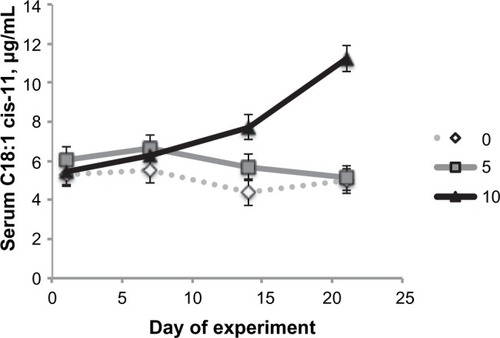
Figure 2 Changes in plasma insulin concentration and HOMA-IR values with palmitoleic acid infusion at three levels.
Abbreviations: LW, lipid weight; d, days; HOMA-IR, Homeostatis Model Assessment-Insulin Resistance.
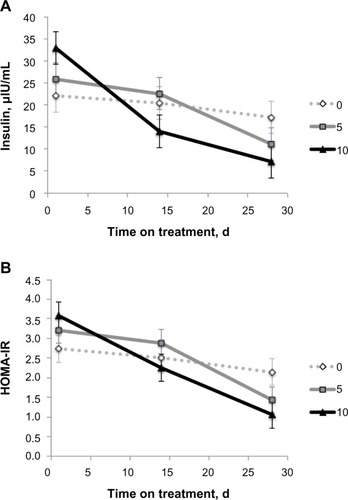
Table 4 Fatty acid composition of tissues (subcutaneous adipose tissue, mesenteric adipose tissue, liver, longissimus muscle, ST muscle) from lambs infused with varying levels of palmitoleic (C16:1) acid
Figure 3 Effects of palmitoleic acid infusion on intramuscular lipid content.
Abbreviations: LM, longissimus muscle; ST, semitendinosus; SQ, subcutaneous; MS, mesenteric; LW, lipid weight; d, days.
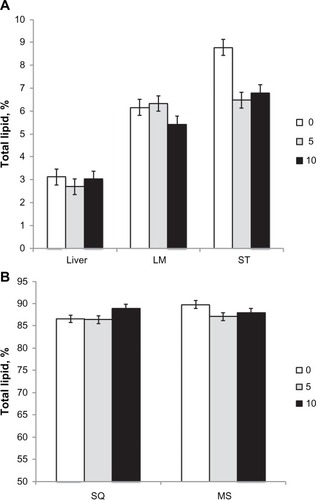
Figure 4 Effects of palmitoleic acid infusion on mean adipocyte size and distribution.
Abbreviations: LW, lipid weight; d, days; IM, intramuscular; SQ, subcutaneous; BW, body weight.
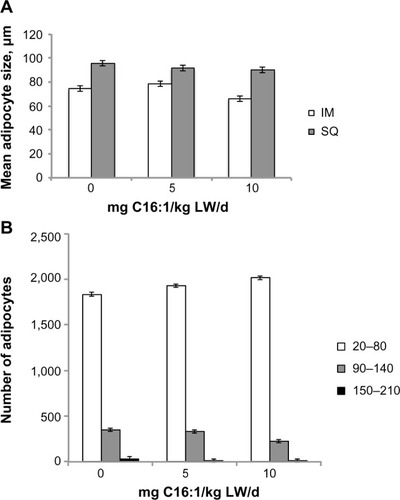
Figure 5 Fold-change in lipogenic gene expression for 10 mg C16:1/kg LW/d versus control (0 mg/kg BW/d) averaged over the three tissues (subcutaneous adipose tissue, ST muscle, and liver).
Abbreviations: BW, body weight; LW, lipid weight; d, days; ST, semitendinosus; SCD, stearoyl-CoA desaturase; FASN, fatty acid synthase; ACC, acetyl-CoA carboxylase; ELOVL5, fatty acid elongase-5; ELOVL6, fatty acid elongase-6; CPT1a, carnitine palmitoyltransferase 1a; HSL, hormone-sensitive lipase; FABP4, fatty acid binding protein 4.
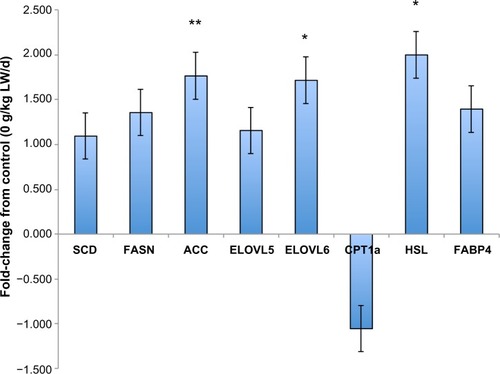
Figure 6 Effects of palmitoleic acid infusion on gene expression and protein content of tissues.
Abbreviations: LW, lipid weight; d, days; BW, body weight; ST, semitendinosus; AMPK, protein kinase, AMP-activated, alpha 1 catalytic subunit, transcript variant 1; P13KR1, phosphoinositide-3-kinase, regulatory subunit 1 (alpha); IR, insulin receptor; AKT1,v-akt murine thymoma viral oncogene homolog 1; IRS1, insulin receptor substrate 1.
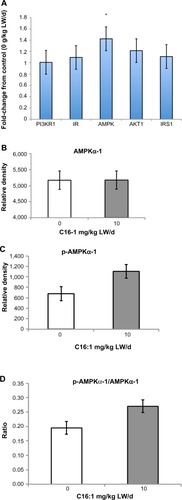
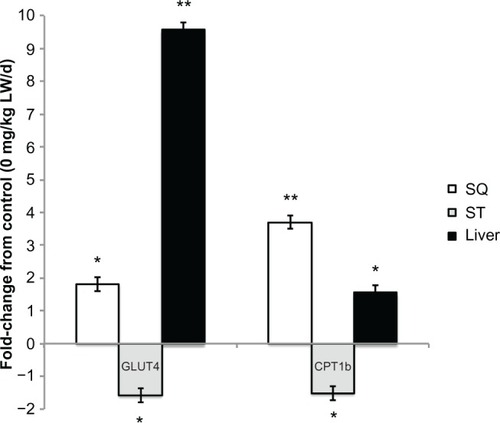
Figure 7 Palmitoleic acid infusion alters gene expression differentially by tissue.
Abbreviations: LW, lipid weight; d, days; ST, semitendinosus; SQ, subcutaneous; GLUT4, glucose transporter type 4; CPT1b, carnitine palmitoyltransferase 1b.