
Figures & data
Table 1 Within- and between-day CV measurements of glucose in saliva samples
Table 2 Population characteristics of the enrolled children
Figure 1 Saliva glucose concentration (Sg) as a function of salivary flow rate (F) by regression analysis.
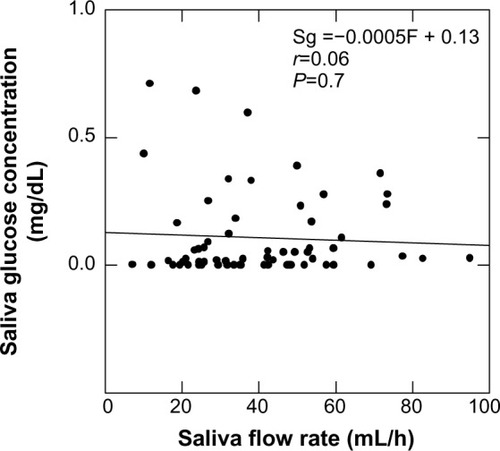
Figure 2 Plasma glucose concentration as a function of salivary glucose concentration.
Notes: (A) Regression analysis of samples from all of the children in the study (mean age 10.6±0.2 y). (B) 2×2 analysis of the diagnostic capability of salivary glucose testing to identify children with high plasma glucose levels (>90 mg/dL) using a value of 0.06 mg/dL in saliva as an identification criterion. (C) Receiver operating curve indicating an area AUC measurement of 0.78.
Abbreviations: TP, true positive (red); FP, false positive (green); TN, true negative (black), FN, false negative (blue); PPV, positive predictive value; NPV, negative predictive value; AUC, area under the curve.
Abbreviations: TP, true positive (red); FP, false positive (green); TN, true negative (black), FN, false negative (blue); PPV, positive predictive value; NPV, negative predictive value; AUC, area under the curve.
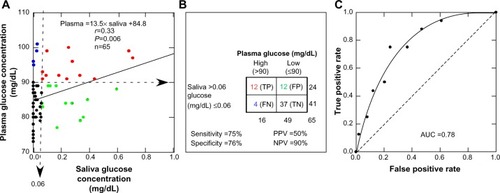
Table 3 Representative studies that provide analytical data for evaluating the relationship between salivary glucose and blood glucose concentrations as a threshold response