
Figures & data
Table 1 Demographic characteristics of the Canadian type 2 diabetes ITT population (N=195) and overall ITT cohort (N=1,114)
Figure 1 Patient disposition, illustrating the derivation of the ITTDP and the Framingham-eligible subsets.
Abbreviations: ITTDP, intention-to-treat diabetic population; HDL, high-density lipoprotein; SBP, systolic blood pressure.
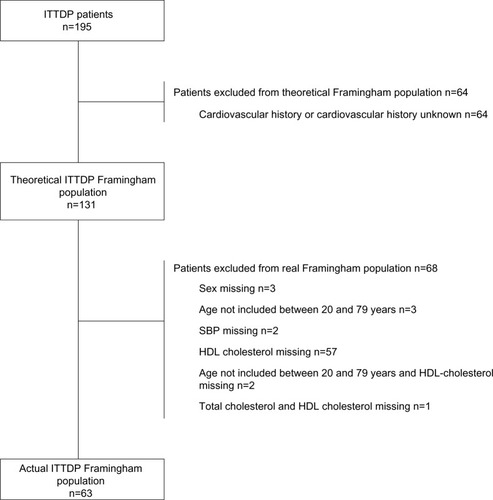
Table 2 Absolute mean change (± standard deviation) of calculated Framingham coronary heart disease risk using formulae, stratified by age
Table 3 Cross-analyses of chart-derived Framingham risk distributions during the study
Table 4 Cross-analyses of formula-derived Framingham risk distributions during the study