Figures & data
Table 1 Baseline characteristics of study participants that completed the 24-week study
Figure 1 Disposition of participants in this study.
Notes: *The adverse events in the Diabetinol® group were diarrhea (n=3), elevated liver enzymes (n=1), and gastric complications (n=1). In the placebo group, one subject withdrew due to diarrhea. Two cases of diarrhea were assessed by the principal investigator as having a possible or probable relationship to the investigational product.
Abbreviations: ITT, intent-to-treat; PI, principal investigator.
Abbreviations: ITT, intent-to-treat; PI, principal investigator.
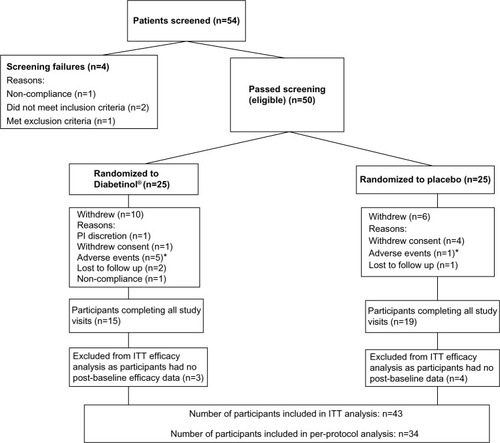
Table 2 Glycemic parameters of study participants that completed the 24-week study
Figure 2 Four-hour postprandial serum glucose and insulin levels after supplementation with placebo or Diabetinol®.
Note: The mean (± SD) 4-hour postprandial serum glucose (A and B) and insulin levels (C and D) in participants at baseline (diamonds, straight line) and after 12 (squares, hatched line) and 24 weeks (triangles, dotted line) of supplementation with placebo (A and C) or Diabetinol® (B and D).
Abbreviations: min, minutes; SD, standard deviation.
Abbreviations: min, minutes; SD, standard deviation.
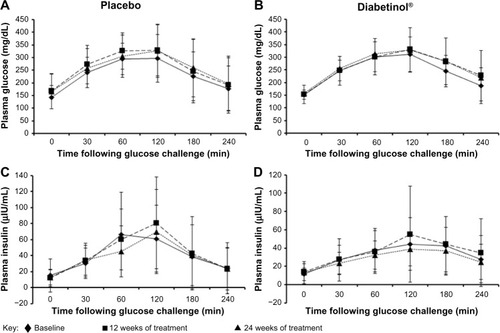
Figure 3 Change from baseline in glycemic parameters after supplementation with placebo or Diabetinol®.
Notes: The mean (± SD) change from baseline in fasting serum (A) blood glucose, (B) fasting insulin, (C) HbA1c levels, and (D) blood glucose levels 2 hours PP after 12 and 24 weeks of supplementation with placebo (N=19, white) or Diabetinol® (N=15, gray). *P=0.08; **P=0.05; #P=0.07 as compared to baseline. Results are presented only for the participants that completed the entire study.
Abbreviations: FBG, fasting blood glucose; HbA1c, hemoglobin A1c; PP, postprandial; SD, standard deviation.
Abbreviations: FBG, fasting blood glucose; HbA1c, hemoglobin A1c; PP, postprandial; SD, standard deviation.
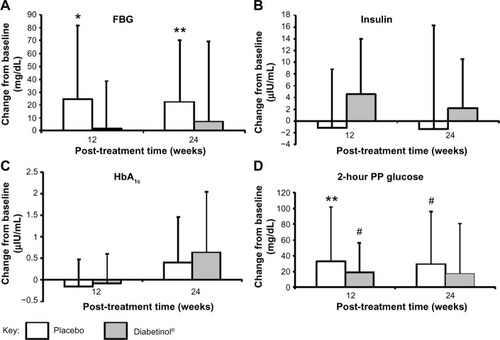
Figure 4 Four-hour postprandial serum glucose levels after supplementation with placebo or Diabetinol®.
Notes: The mean (± SD) 4-hour postprandial serum glucose levels in participants aged 40–60 years at baseline (diamonds, straight line) and after 12 (squares, hatched line) and 24 weeks (triangles, dotted line) of supplementation with (A) placebo or (B) Diabetinol®.
Abbreviations: min. minutes, SD, standard deviation.
Abbreviations: min. minutes, SD, standard deviation.
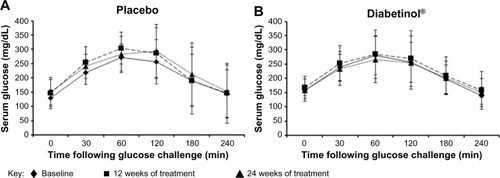
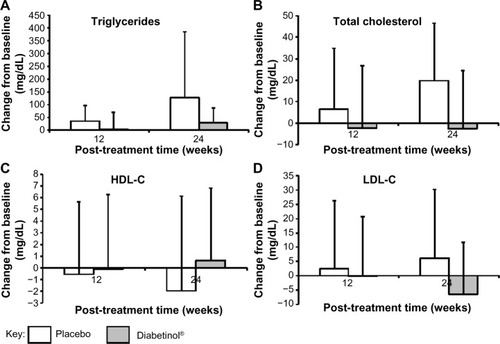
Figure 5 Change from baseline in blood lipid parameters after supplementation with placebo or Diabetinol®.
Notes: The mean (± SD) change from baseline in (A) triglyceride, (B) total cholesterol, (C) HDL-C, and (D) LDL-C concentrations after 12 and 24 weeks of supplementation with placebo (white) or Diabetinol® (gray).
Abbreviations: HDL-C, high-density lipoprotein cholesterol; LDL-C, low-density lipoprotein cholesterol; SD, standard deviation.
Abbreviations: HDL-C, high-density lipoprotein cholesterol; LDL-C, low-density lipoprotein cholesterol; SD, standard deviation.