Figures & data
Table 1 RT-PCR probes ID and sequences
Figure 1 PDE5-inhibitors combined with Leu increases fatty acid oxidation in vitro.
Abbreviations: PDE5, phosphodiesterase 5; Leu, leucine; OCR, oxygen consumption rate; AUC, area under the curve; Sild, sildenafil; Icar, icariin; SD, standard deviation.
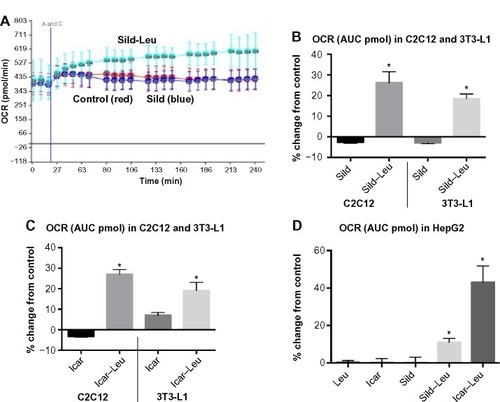
Figure 2 PDE5-inhibitors combined with Leu increases NO production and mitochondrial biogenesis in vitro.
Abbreviations: AFU, arbitrary fluorescence units; DAF-2DA, diaminofluorescein-2 diacetate; PDE5, phosphodiesterase 5; Leu, leucine; NAO, 10-N-nonyl-acridine orange; NO, nitric oxide; ns, not significant; Sild, sildenafil; Icar, icariin; SEM, standard error of the mean.
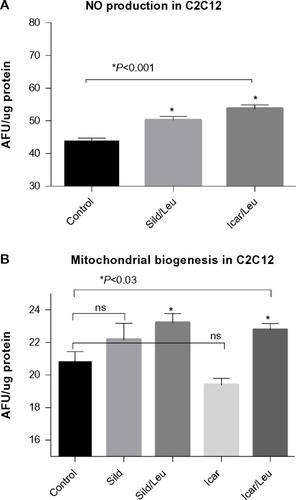
Figure 3 PDE5-inhibitors combined with Leu increases glucose utilization in vitro.
Abbreviations: PDE5, phosphodiesterase 5; ECAR, extracellular acidification rate; AUC, area under the curve; Sild, sildenafil; Leu, leucine; SD, standard deviation.
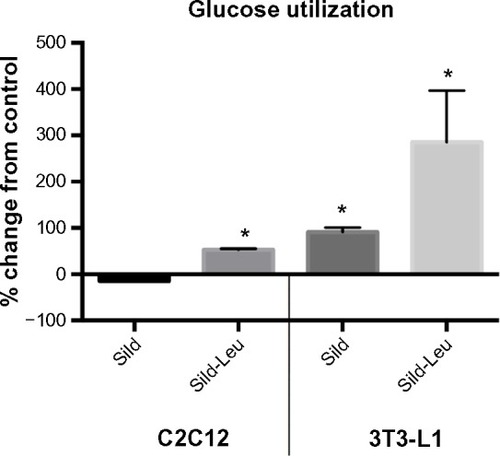
Figure 4 PDE5-inhibitors combined with Leu increases insulin signaling in vitro.
Abbreviations: Ins, insulin; PDE5, phosphodiesterase 5; CTRL, control; Sild, sildenafil; Leu, leucine; SEM, standard error of the mean; P-IRS, phosphorylated insulin receptor substrate; P-AKT, phosphorylated protein kinase B.
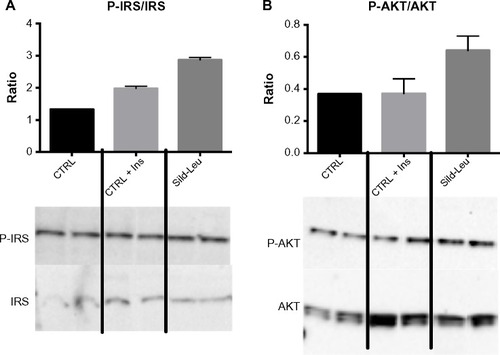
Figure 5 Body weight measurements of the DIO-mice.
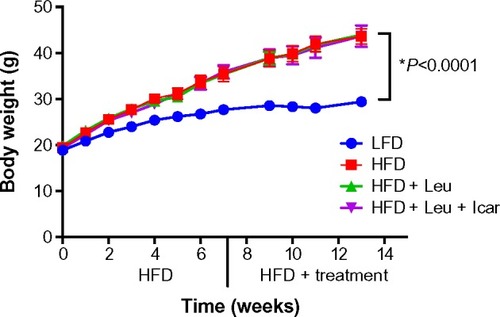
Figure 6 Leu and Icar combination lowers plasma glucose and insulin levels in DIO-mice.
Abbreviations: DIO, diet-induced obese; HFD, high-fat diet; LFD, low-fat diet; Leu, leucine; Icar, icariin; ns, not significant; SEM, standard error of the mean.
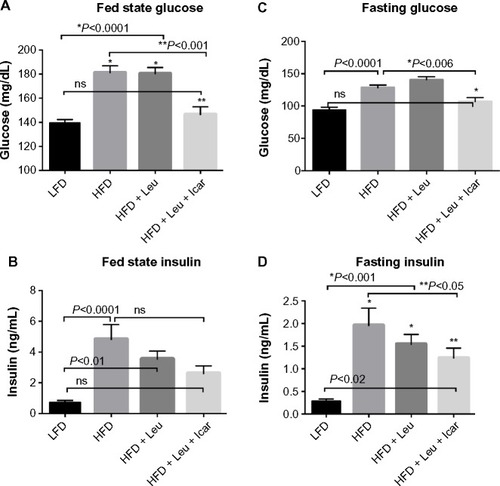
Figure 7 Leu and Icar combination improves insulin sensitivity in DIO-mice.
Abbreviations: DIO, diet-induced obese; GTT, glucose tolerance test; ITT, insulin tolerance test; LFD, low-fat diet; HFD, high-fat diet; Leu, leucine; Icar, icariin; AUC, area under the curve; SEM, standard error of the mean.
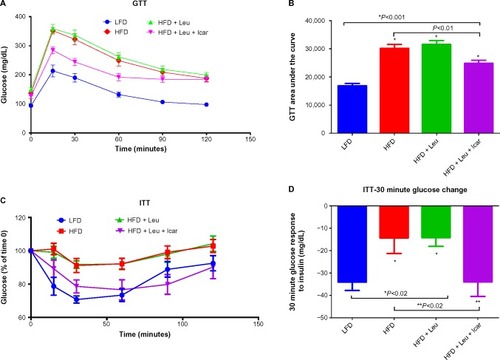
Figure 8 Leu and Icar combination promotes muscle fatty acid oxidation in DIO-mice.
Abbreviations: Leu, leucine; Icar, icariin; DIO, diet-induced obese; HFD, high-fat diet; LFD, low-fat diet; PPARα, peroxisome proliferator-activated receptor alpha; COX1, cyclooxygenase 1; ACOX1, acyl-CoA oxidase; CPT1B, carnitine palmitoyltransferase 1B; SEM, standard error of the mean; ns, not significant.
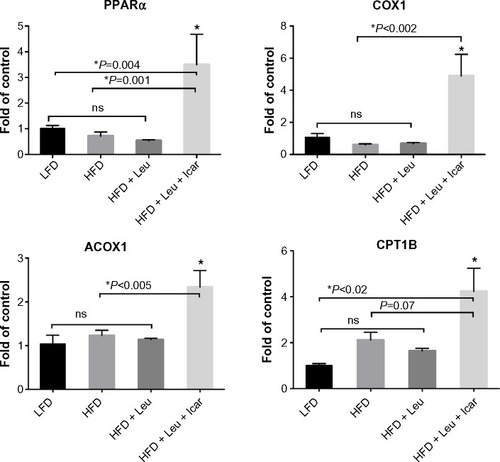
Figure 9 Leu and Icar combination inhibits hepatic lipogenesis and promotes hepatic fatty acid oxidation in DIO-mice.
Abbreviations: Leu, leucine; Icar, icariin; DIO, diet-induced obese; HFD, high-fat diet; CRP, C-reactive protein; IL-1β, inflammatory markers interleukin-1 beta; TNFα, tumor necrosis factor alpha; IL-6, interleukin 6; MCP1, monocyte chemotactic protein 1; LFD, low-fat diet; SEM, standard error of the mean; ns, not significant.
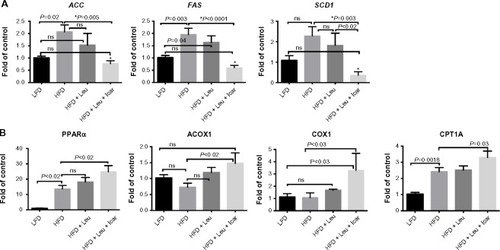
Figure 10 Leu and Icar combination prevents hepatic steatosis in DIO-mice.
Abbreviations: Leu, leucine; Icar, icariin; DIO, diet-induced obese; ACC, acetyl CoA carboxylase; FAS, fatty acid synthase; SCD1, stearoyl-CoA desaturase-1; PPARα, peroxisome proliferator-activated receptor alpha; ACOX1, acyl-CoA oxidase; COX1, cyclooxygenase 1; CPT1A, carnitine palmitoyltransferase 1A; HFD, high-fat diet; LFD, low-fat diet; SEM, standard error of the mean; ns, not significant.
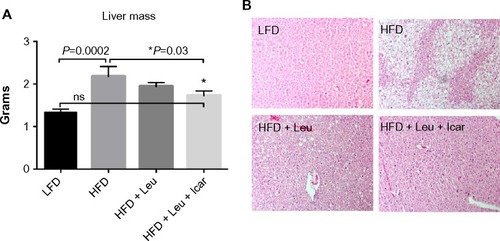
Figure 11 Leu and Icar combination suppresses inflammation in liver of DIO-mice.
Abbreviations: Leu, leucine; Icar, icariin; DIO, diet-induced obese; HFD, high-fat diet; LFD, low-fat diet; SEM, standard error of the mean; ns, not significant.
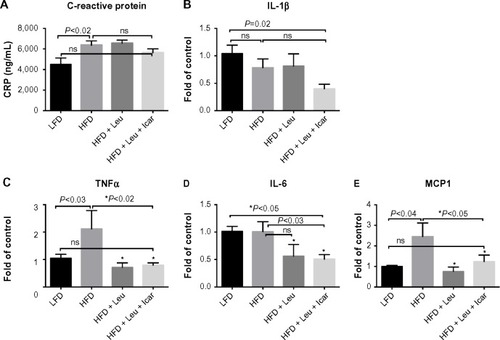
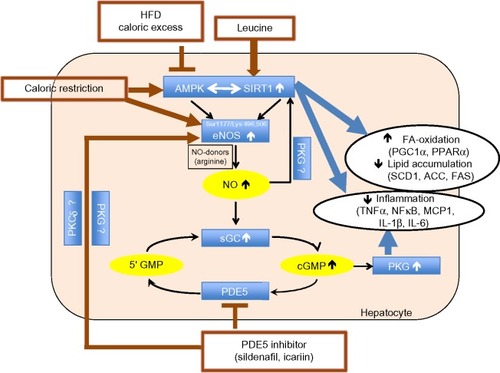
Figure 12 Summary of the three-way interaction among AMPK, SIRT1, and eNOS.
Abbreviations: eNOS, endothelial nitric oxide synthase; AMPK, AMP-activated protein kinase; NO, nitric oxide; PKG, cGMP-activated protein kinase; HFD, high-fat diet; PDE5, phosphodiesterase 5 inhibition; PGC1α, peroxisome proliferator-activated receptor γ co-activator α; PPARα, peroxisome proliferator-activated receptor alpha; SCD1, stearoyl-CoA desaturase-1; ACC, acetyl CoA carboxylase; FAS, fatty acid synthase; TNFα, tumor necrosis factor alpha; NFκβ, nuclear factor-kappaB; MCP1, monocyte chemotactic protein 1; IL-1β, interleukin-1 beta; IL-6, interleukin 6; FA, fatty acid.