Figures & data
Table 1 Respondent characteristics by BMI category
Figure 1 Prevalence of comorbidities by BMI category.
Note: *P<0.05 compared with normal weight.
Abbreviation: BMI, body mass index.
Abbreviation: BMI, body mass index.
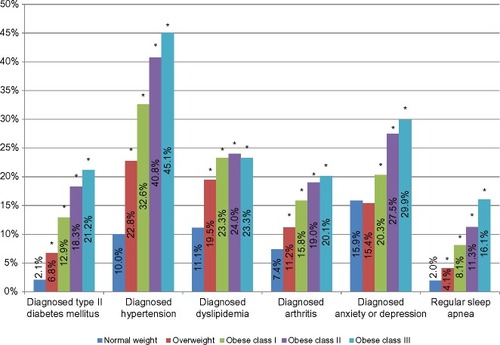
Table 2 Health outcomes by different BMI categories in the EU5
Figure 2 Health utilities as a function of different BMI categories, controlling for covariates.
Notes: Presented are adjusted means with 95% confidence intervals. Generalized linear regression models controlled for age, sex, diagnosed hypertension, diagnosed depression/anxiety, experiencing sleep apnea regularly, and the Charlson Comorbidity Index. *P<0.05 compared with normal weight and ^exceed minimally important difference compared with normal weight.
Abbreviations: BMI, body mass index; SF-6D, Short Form-six dimension health utilities.
Abbreviations: BMI, body mass index; SF-6D, Short Form-six dimension health utilities.
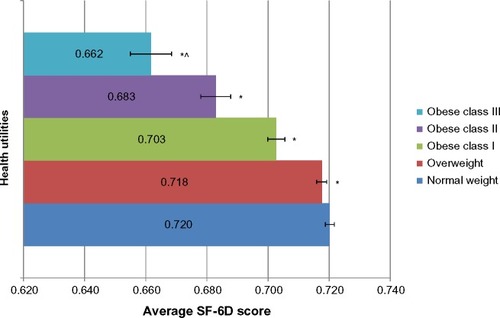
Figure 3 Work and activity impairment as a function of different BMI categories, controlling for covariates.
Notes: Presented are adjusted means with 95% confidence intervals. Generalized linear regression models controlled for age, sex, diagnosed hypertension, diagnosed depression/anxiety, experiencing sleep apnea regularly, and the Charlson Comorbidity Index. *P<0.05 compared with normal weight.
Abbreviation: BMI, body mass index.
Abbreviation: BMI, body mass index.
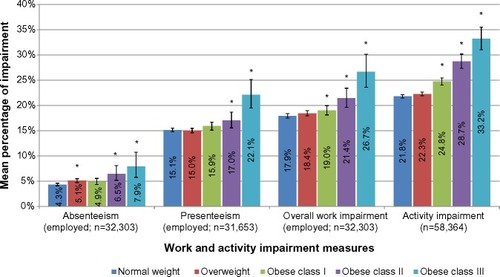
Figure 4 Resource utilization as a function of different BMI categories, controlling for covariates.
Notes: Presented are adjusted means with 95% confidence intervals. Generalized linear regression models controlled for age, sex, diagnosed hypertension, diagnosed depression/anxiety, experiencing sleep apnea regularly, and the Charlson Comorbidity Index. *P<0.05 compared with normal weight.
Abbreviation: BMI, body mass index.
Abbreviation: BMI, body mass index.
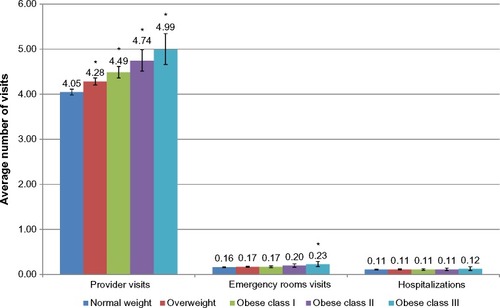
Figure 5 Indirect costs as a function of different BMI categories, controlling for covariates.
Notes: Presented are adjusted means with 95% confidence intervals. Generalized linear regression models controlled for age, sex, diagnosed hypertension, diagnosed depression/anxiety, experiencing sleep apnea regularly, and the Charlson Comorbidity Index. *P<0.05 compared with normal weight.
Abbreviation: BMI, body mass index.
Abbreviation: BMI, body mass index.
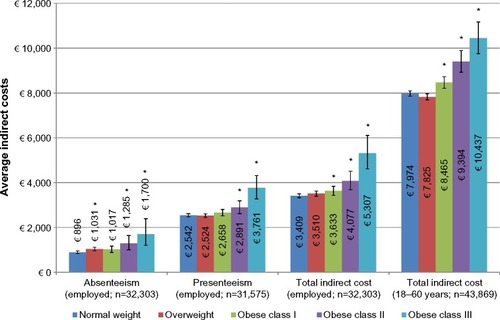
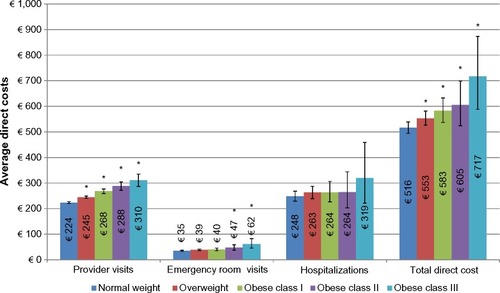
Figure 6 Direct costs as a function of different BMI categories, controlling for covariates.
Notes: Presented are adjusted means with 95% confidence intervals. Generalized linear regression models controlled for age, sex, diagnosed hypertension, diagnosed depression/anxiety, experiencing sleep apnea regularly, and the Charlson Comorbidity Index. *P<0.05 compared with normal weight.
Abbreviation: BMI, body mass index.
Abbreviation: BMI, body mass index.