Figures & data
Table 1 Criteria of diabetic patients and healthy controls
Table 2 The studied CBC indices in diabetic patients with A1c ≤7% vs patients with A1c >7%
Figure 1 Red cell distribution width in diabetic patients (n=260) vs controls (n=44).
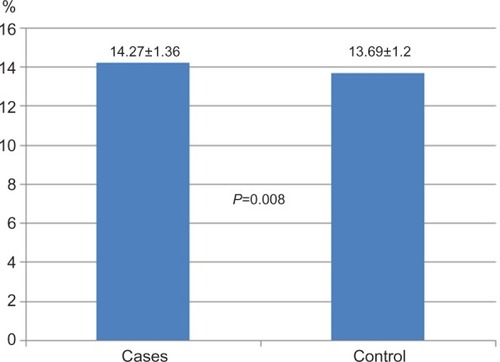
Table 3 Correlations of CBC indices with various variables
Table 4 r and P-values of the correlations between WBC count and other CBC indices
Table 5 P-values of the effects of different medications in patients (in comparison with controls)
Figure 2 No effect of aspirin on mean platelet volume (MPV) in diabetic patients (n=163) in comparison to control (n=44); P=0.368.
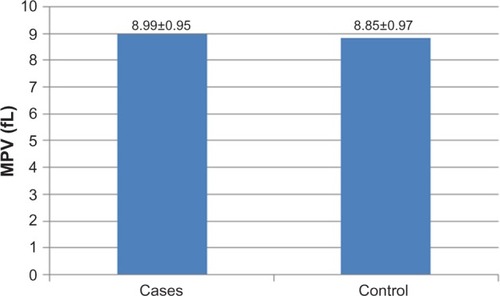
Figure 3 No effect of clopidogrel on mean platelet volume (MPV) in diabetic patients (n=14) in comparison to control (n=44); P=0.89.
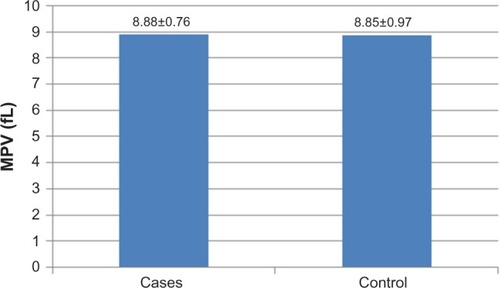
Table 6 Comparison of the studied CBC indices in pre- and postmenopausal females
Table 7 CBC indices in pre- and postmenopausal females in comparison with males
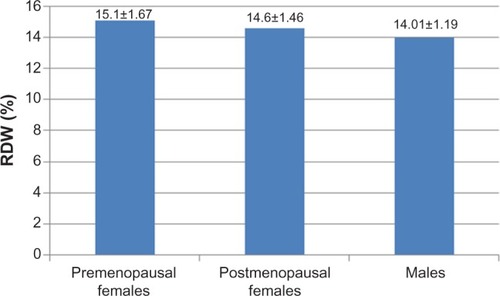
Figure 4 RDW in premenopausal (n=20) and postmenopausal females (n=78) vs males (n=162; P≤0.0001 and 0.001 consecutively).
Abbreviation: RDW, red cell distribution width.