Figures & data
Table 1 Characteristics of the study subjects
Table 2 Biochemical parameters of the study groups
Figure 1 Prevalence of abnormal levels of CRP and lipid parameters in the study groups.
Abbreviations: LDL-C, low-density lipoprotein cholesterol; HDL-C, high-density lipoprotein cholesterol; TG, triglycerides; TC, total cholesterol; CRP, C-reactive protein.
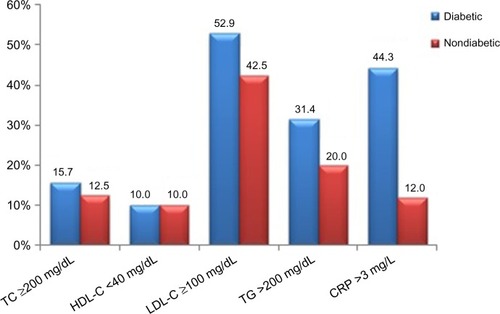
Table 3 Odd ratios for CRP and lipid profile
Table 4 Correlation analysis of CRP with lipid profile and BMI in diabetics
Figure 2 Regression lines for (A) C-reactive protein and low-density lipoprotein cholesterol and (B) C-reactive protein and body mass index.
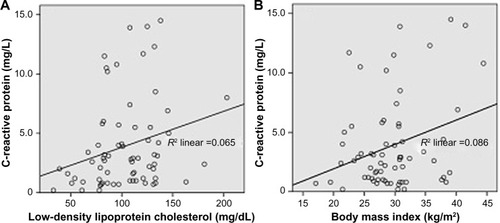
Table 5 Logistic regression of CRP, lipid parameters, and HbA1c in diabetics
Figure S1 Structured patient questionnaire.