Figures & data
Table 1 Clinical and biochemical characteristics of the 4606 Mexican students recruited in this study
Table 2 Weight, BMI, and waist circumference values in the population studied (n = 4606) between 1994 and 2008
Figure 1 Mean weight A, BMI B and waist circumference C of the men (gray) and women (white) studied between 1994 and 2008.
Error bars represent CI 95%. Women: weight 1994 vs 1999 (P = 0.03) and 2008 (P = 0.05); BMI 1997 (P = 0.006), 1998 (P = 0.04) and 1999 (P = 0.01) vs 2008; and waist circumference 1994 throughout 2008 all P < 0.0001. Men: weight 1994 (P < 0.001), 1998 (P < 0.001) and 1999 (P = 0.009) vs 2008; BMI and waist circumference 1994 throughout 2008 (all P < 0.001) (except weight 1997 vs 2008, P = 0.07).
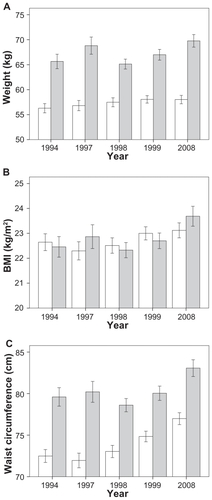
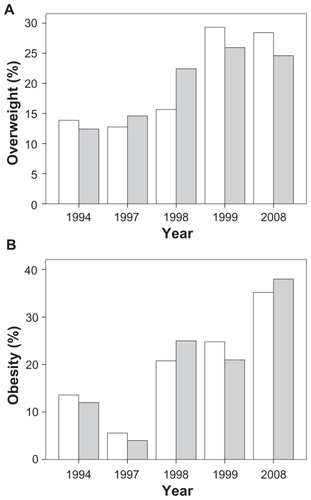
Figure 2 Prevalence of overweight and obesity in men (gray) and women (white) between 1994 and 2008.