Figures & data
Figure 1 Genotyping the kinin B1 and B2 receptor in B1B2KO mice.
Notes: (A) B1 and (B) B2 receptor gene fragments were amplified by polymerase chain reaction. The contractile response of smooth muscle strips from the gastric fundus to Cch (positive control), BK, and DBK in (C) WT and (D) B1B2KO mice.
Abbreviations: BK, bradykinin; DBK, des-Arg(9)-bradykinin; N, negative control; WT, wild-type; B1B2−/−, B1B2KO; Cch, carbachol.
Abbreviations: BK, bradykinin; DBK, des-Arg(9)-bradykinin; N, negative control; WT, wild-type; B1B2−/−, B1B2KO; Cch, carbachol.
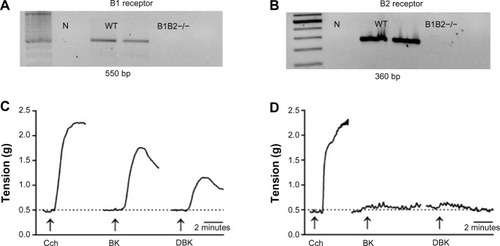
Figure 2 B1B2KO mice are protected against obesity induced by HFD treatment and present lower food intake and feed efficiency.
Notes: (A) Body weight after 12 weeks of HFD treatment. *P<0.05 WT HFD versus B1B2KO groups; #P<0.05 versus all groups. Data are expressed as the mean ± standard error of the mean and represent mouse weight per gram. White circles indicate WT control, black circles indicate WT HFD, white triangles indicate B1B2KO control, and black triangles indicate B1B2KO HFD. (B) Visceral fat weight after 12 weeks of HFD treatment. White bars indicate WT control and HFD, and black bars indicate B1B2KO control and HFD. #P<0.05 WT HFD versus WT control; **P<0.01 WT HFD versus B1B2KO HFD. Data are expressed as the mean ± standard error of the mean and represent visceral fat depot weight per gram. (C) Energy intake after 12 weeks of HFD treatment. Energy intake was calculated based on information from the chow manufacturer. White circles indicate WT control, black circles indicate WT HFD, white triangles indicate B1B2KO control, and black triangles indicate B1B2KO HFD. *P<0.05 WT HFD versus B1B2KO HFD; #P<0.05 WT control versus B1B2KO control. Data are expressed as the mean ± standard error of the mean and represent energy intake (kCal). (D) Cumulative food intake after 12 weeks of HFD treatment. White bars indicate WT control and HFD, black bars indicate B1B2KO control and HFD. *P<0.05 WT control versus B1B2KO control; #P<0.05 WT HFD versus B1B2KO HFD. Data are expressed as the mean ± standard error of the mean and represent chow per gram. (E) Feed efficiency after 12 weeks of HFD treatment. Feed efficiency was calculated by the ratio of total weight gain and calories of food ingested after the HFD treatment in both WT and B1B2KO mice. White bars indicate WT control and HFD, black bars indicate B1B2KO control and HFD. P<0.01 WT HFD versus control diet group. **P<0.01 WT HFD versus B1B2KO HFD. Data are expressed as the mean ± standard error of the mean and represent energy intake (kCal).
Abbreviations: HFD, high-fat diet; WT, wild-type.
Abbreviations: HFD, high-fat diet; WT, wild-type.
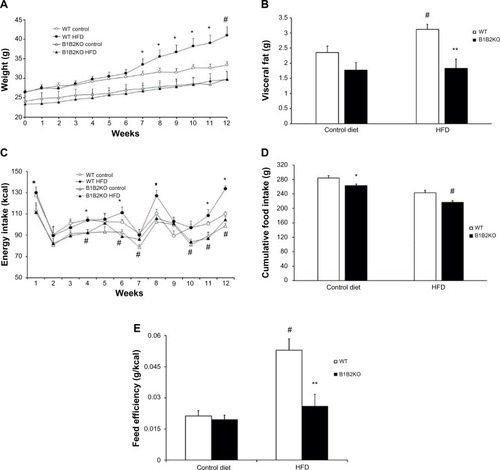
Figure 3 B1B2KO mice have low insulin and leptin levels.
Notes: (A) Serum leptin levels after 12 weeks of HFD treatment. (B) Serum insulin levels after 12 weeks of HFD treatment. (C) Leptin mRNA expression in white adipose tissue after 12 weeks of HFD treatment. White bars indicate WT control and HFD, and black bars indicate B1B2KO control and HFD. *P<0.05 B1B2KO control versus WT control; **P<0.01 B1B2KO HFD versus WT HFD; #P<0.05 WT HFD versus WT control. (D) Leptin sensitivity test in WT and B1B2KO mice. Consumption was measured after intraperitoneal injection of 40 µg/day of leptin and compared with basal consumption. Data are expressed as the mean ± standard error of the mean and represent percentage of food intake. White squares indicate WT, black squares indicate B1B2KO. (E) Insulin sensitivity test after 12 weeks of HFD treatment. Glycemia was measured before and after intraperitoneal injection of insulin 0.01 U/kg at following the times: 0, 15, 30, and 60 minutes. Data are expressed as the mean ± standard error of the mean. White circles indicate WT control, black circles indicate WT HFD, white triangles indicate B1B2KO control, and black triangles indicate B1B2KO HFD. *P<0.05 WT HFD versus all groups.
Abbreviations: HFD, high-fat diet; WT, wild-type.
Abbreviations: HFD, high-fat diet; WT, wild-type.
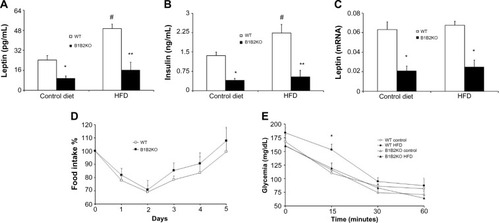
Figure 4 B1B2KO mice show high glucose tolerance.
Notes: (A) Glucose levels after 12 weeks of HFD treatment. White bars indicate WT control and HFD, black bars indicate B1B2KO control and HFD. *P<0.05 WT HFD versus B1B2KO HFD. (B) Glucose tolerance test after 12 weeks of HFD treatment. Glycemia was measured before and after intraperitoneal injection of glucose 1 g/kg at the following times: 0, 15, 30, 60, and 120 minutes. Data are expressed as the mean ± standard error of the mean. White circles indicate WT control, black circles indicate WT HFD, white triangles indicate B1B2KO control, and black triangles indicate B1B2KO HFD. *P<0.05 WT HFD versus all groups and #P<0.05 WT HFD versus B1B2KO HFD.
Abbreviations: HFD, high-fat diet; WT, wild-type.
Abbreviations: HFD, high-fat diet; WT, wild-type.
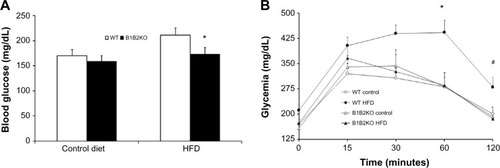
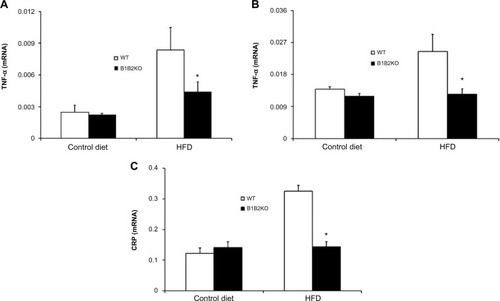
Figure 5 Inflammatory cytokines are downregulated in tissues of B1B2KO mice.
Notes: TNF-α mRNA expression in white adipose tissue (A) and skeletal muscle tissue (B) after 12 weeks of HFD treatment. (C) CRP mRNA expression in the liver after 12 weeks of HFD treatment. Data are expressed as the mean ± standard error of the mean of the 2−ΔCt parameter and represent the relative expression between TNF-α/CRP and β-actin. White bars indicate WT control and HFD, black bars indicate B1B2KO control and HFD. *P<0.05 B1B2KO HFD versus WT HFD.
Abbreviations: HFD, high-fat diet; WT, wild-type; CRP, C-reactive protein; TNF-α, tumor necrosis factor-alpha.
Abbreviations: HFD, high-fat diet; WT, wild-type; CRP, C-reactive protein; TNF-α, tumor necrosis factor-alpha.