Figures & data
Figure 1 Changes in the blood pressure of control and STZ-induced DM rats after the administration of human prorenin and human angiotensinogen.
Notes: (A) Records of arterial blood pressure in a control and diabetic rat injected with human prorenin and angiotensinogen. (B) Graphs showing the variations in the SBP and DBP in control and diabetic rats. A significant increase in blood pressure was observed only in the diabetic rats. White bars indicate control and black bars indicate diabetic rats. *P<0.05, **P<0.01, ***P<0.001 vs changes after prorenin injection for each group, + P<0.05, ++ P<0.01 vs the control rats at the same dose. N=4 in each group.
Abbreviations: DBP, diastolic blood pressure; DM, diabetes mellitus; SBP, systolic blood pressure; STZ, streptozotocin.
Abbreviations: DBP, diastolic blood pressure; DM, diabetes mellitus; SBP, systolic blood pressure; STZ, streptozotocin.
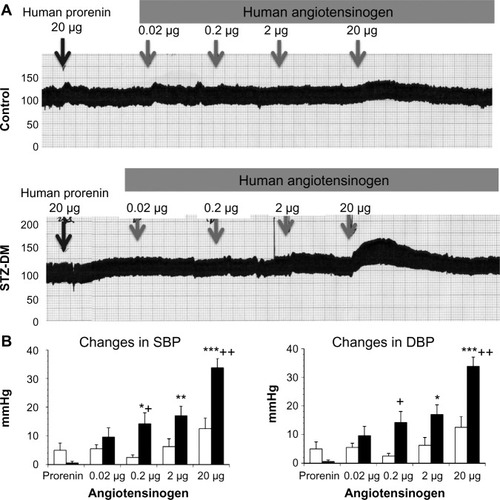
Figure 2 The uptake of exogenous human prorenin is enhanced in diabetic rats.
Notes: Immunostaining for human prorenin (brown color staining in A–D) in podocytes (arrows), proximal tubules (P), macula densa (asterisks), and distal nephrons (DT) including cortical collecting ducts, appeared enhanced in diabetic rats (B and D) compared with controls (A and C). Bar: 100 μm. A Western blot analysis for human prorenin demonstrating an increased uptake of human prorenin in the whole kidney homogenates (E and F) and also in glomerular and tubular fractions in diabetic rats (G). # P<0.01 vs control.
Abbreviations: DM, streptozotocin-induced diabetes mellitus rats; lc, loading control.
Abbreviations: DM, streptozotocin-induced diabetes mellitus rats; lc, loading control.
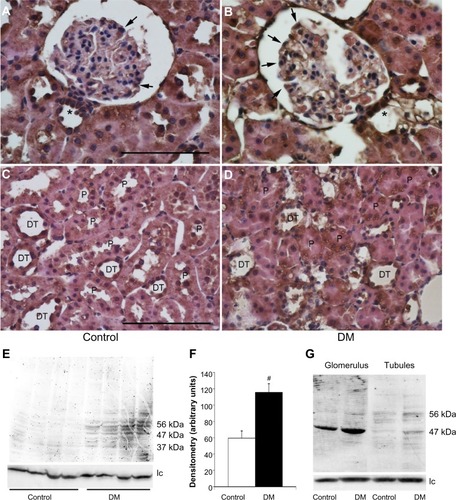
Figure 3 Pre-embedding electron microscopy for human prorenin.
Notes: Black label for human prorenin was detected in podocyte vesicles and proximal tubules in diabetic rats 40 minutes after its first intravenous injection (arrows), but was barely detected in controls. Bar: 500 nm.
Abbreviation: DM, diabetes mellitus rats.
Abbreviation: DM, diabetes mellitus rats.
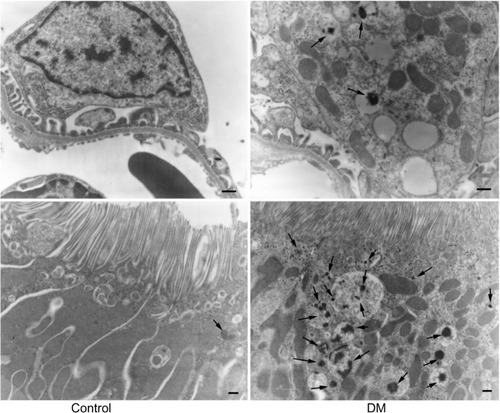
Figure 4 The expression of the prorenin receptor in normal and diabetic rats.
Notes: Immunohistochemical analysis of the prorenin receptor in podocytes (arrows), proximal tubules (P), macula densa (asterisks), and distal nephron including cortical collecting ducts (DT), appeared increased in diabetic rats (B and D) compared with controls (A and C). This was confirmed by the results of a Western blot analysis (E and F). #P<0.05 vs control. Bar: 100 μm.
Abbreviations: DM, diabetes mellitus rats; lc, loading control.
Abbreviations: DM, diabetes mellitus rats; lc, loading control.
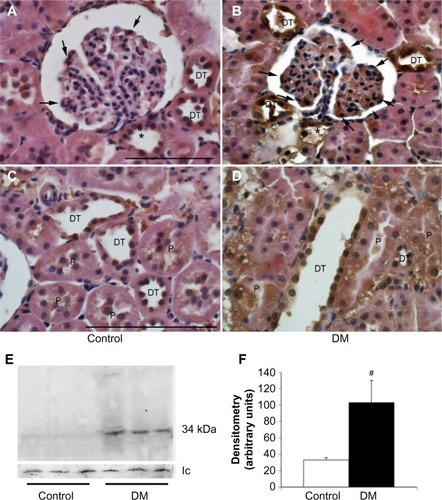
Figure 5 Immunoprecipitation of human prorenin by antibodies for megalin (A) or the prorenin receptor (B).
Note: The level of renal human prorenin bound to both megalin and the prorenin receptor was increased in diabetic rats compared with controls.
Abbreviations: DM, diabetes mellitus rats; IP, immunoprecipitation; WB, Western blot.
Abbreviations: DM, diabetes mellitus rats; IP, immunoprecipitation; WB, Western blot.
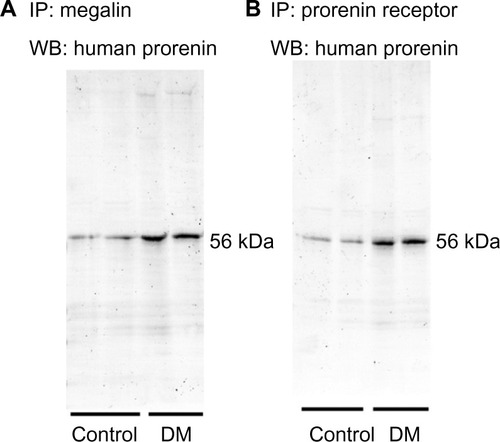
Figure 6 Human angiotensinogen uptake in normal and diabetic rats.
Notes: Immunohistochemical analysis for human angiotensinogen expression (brown color staining in A–D) in podocytes (arrows), proximal tubules (P), *macula densa and the distal nephron (DT) including collecting ducts and endothelial cells of renal small artery (C and D) appeared increased in diabetic rats, especially in podocytes. Western blot for human angiotensinogen demonstrated that the specificity of the antibody which reacted with human angiotensinogen in a dose-dependent manner, but only weakly with rat angiotensinogen (E). Western blot analysis showed increased human angiotensinogen uptake in the glomerular fraction of DM rats, but slightly increased in the tubular fraction of DM rats compared with those of control (F and G). **P<0.001, ***P<0.0001 vs control. Bar: 100 μm.
Abbreviations: Atg, angiotensinogen; DM, diabetes mellitus rats.
Abbreviations: Atg, angiotensinogen; DM, diabetes mellitus rats.
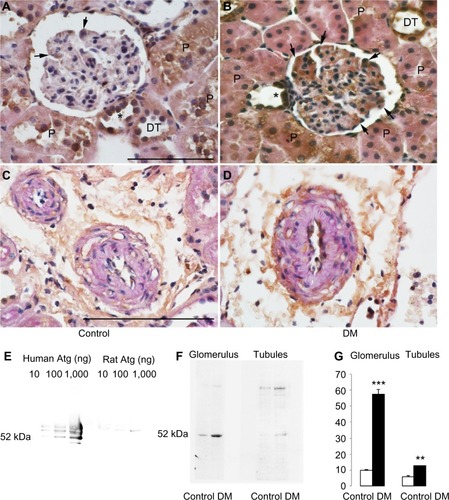
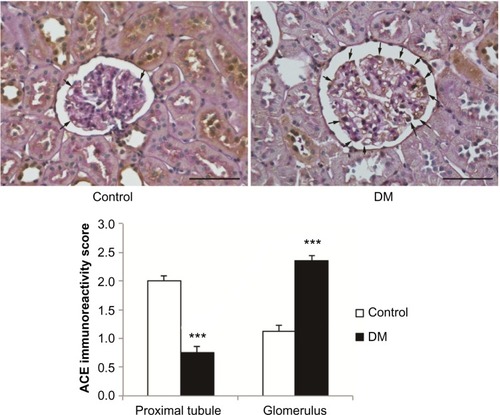
Figure 7 The expression of ACE in normal and diabetic rats.
Notes: The semiquantification of immunoreactivity for ACE indicated reduced brush border membrane of proximal tubules but enhanced podocytes of diabetic rats (arrows). ***P<0.0001. Bar: 100 μm.
Abbreviations: ACE, angiotensin-converting enzyme; DM, diabetes mellitus rats.
Abbreviations: ACE, angiotensin-converting enzyme; DM, diabetes mellitus rats.