
Figures & data
Figure 1 The effects of genistein treatment on body mass and serum glucose in ob/ob mice.
Notes: There was no difference between control and genistein-fed mice in body mass (50.9±2.1 g and 46.3±1.2 g, respectively, P=0.06) or serum glucose in control (465.1±22.1 mg/dL and 408.7±37.5 mg/dL, respectively, P=0.22). Data are shown as mean ± 2 SE.
Abbreviation: SE, standard error.
Abbreviation: SE, standard error.
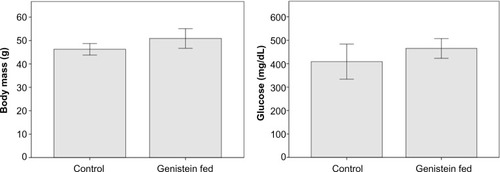
Table 1 The effects of genistein treatment on cross-sectional geometric properties of the tibial midshaft in ob/ob mice
Figure 2 Micrographs of the proximal tibial growth plate of (A) control and (B) genistein-fed ob/ob mice.
Notes: Scale bar is 100 μm. Toluidine blue and aqueous fast green stains were used, 40× magnification.
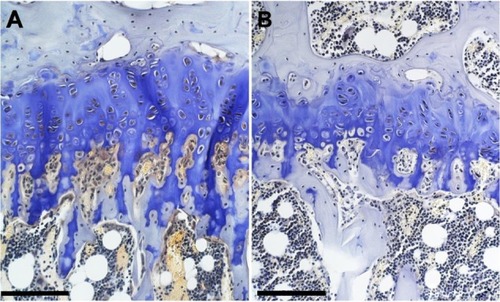
Figure 3 Growth plate thickness in control and genistein fed mice.
Notes: Growth plate thickness was significantly reduced in genistein-treated mice (42.7±1.98 μm) in comparison with controls (49.3±1.96 μm, P=0.03). There was no difference in the thickness of the calcified cartilage layer between genistein treated (18.6±1.16 μm) and control mice (21.0 ± 1.14 μm, P=0.20). Data are shown as mean ± 2 SE.
Abbreviation: SE, standard error.
Abbreviation: SE, standard error.
